Pleasant Hill: Fire Incidents, Oregon (OR)
Where are fire incidents reported in Pleasant Hill, OR
Something went wrong! Please refresh the page.
|
| |||||||||||||||||||||||||||||||||||||||||||||||||||||||||||||||||||||||||||||||||||||||||||||||||||||||||||||
2002 - 2018 National Fire Incident Reporting System (NFIRS) incidents
- Incident types reported to NFIRS in Pleasant Hill, OR
- 1,19760.4%Rescue & EMS
- 33216.7%Fire
- 28614.4%Good Intent Call
- 1005.0%Hazardous Condition
- 462.3%Service Call
- 201.0%False Alarm
- Fire incident types reported to NFIRS in Pleasant Hill, OR
- 14042.2%Structure Fires
- 13340.1%Outside Fires
- 4513.6%Mobile Property/Vehicle Fires
- 144.2%Other
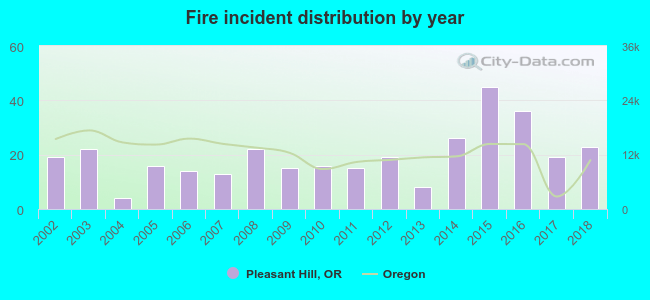 Based on the data from the years 2002 - 2018 the average number of fires per year is 20. The highest number of reported fire incidents - 45 took place in 2015, and the least - 4 in 2004. The data has an increasing trend.
The average number of yearly fire incidents per 10k residents in Pleasant Hill, OR compared to nearest cities:
(Note: Based on data for the last 3 years, including only cities with population 5,000 and above)
| Pleasant Hill: | 45.9 |
| Creswell: | 24.8 |
| Springfield: | 18.4 |
| Eugene: | 24.4 |
| Cottage Grove: | 26.7 |
| Junction City: | 44.4 |
| Sweet Home: | 30.3 |
| Lebanon: | 31.7 |
| Corvallis: | 10.1 |

 34.9% incidents where reported in the morning and 65.1% in the evening. The most fires (17.5%) took place on Saturday, and the least (9.9%) on Sunday.
 Based on the 332 incident reports from years 2002 - 2018 most fires (14.2%) took place during September, and the least (4.8%) in November.
 Out of all 1,983 cases reported during the years 2002 - 2018, the most belonged to the categories: Rescue & EMS (60.4%), Fire (16.7%), and Good Intent Call (14.4%).
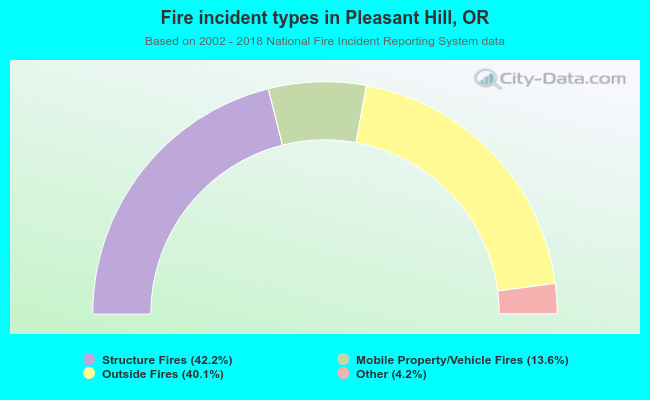 When looking into fire subcategories, the most reports belonged to: Structure Fires (42.2%), and Outside Fires (40.1%).