Port Jervis: Fire Incidents, New York (NY)
Where are fire incidents reported in Port Jervis, NY
Something went wrong! Please refresh the page.
|
| |||||||||||||||||||||||||||||||||||||||||||||||||||||||||||||||||||||||||||||||||||||||||||||||||||||||||||||
2002 - 2018 National Fire Incident Reporting System (NFIRS) incidents
- Incident types reported to NFIRS in Port Jervis, NY
- 80330.9%False Alarm
- 67626.0%Hazardous Condition
- 33112.7%Service Call
- 29811.5%Fire
- 2449.4%Rescue & EMS
- 2228.5%Good Intent Call
- 130.5%Special Incident
- 60.2%Overpressure Rupture
- 60.2%Severe Weather
- Fire incident types reported to NFIRS in Port Jervis, NY
- 13645.6%Structure Fires
- 8026.8%Outside Fires
- 5217.4%Mobile Property/Vehicle Fires
- 3010.1%Other
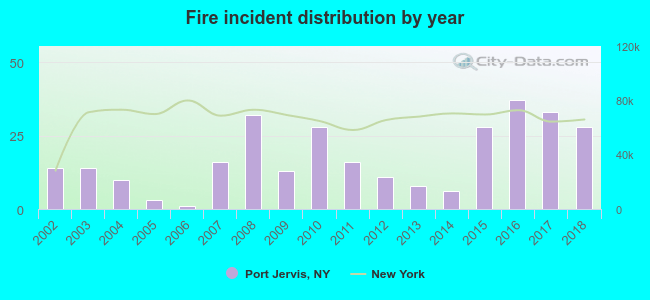 Based on the data from the years 2002 - 2018 the average number of fires per year is 18. The highest number of fire incidents - 37 took place in 2016, and the least - 1 in 2006. The data has a growing trend.
The average number of yearly fire incidents per 10k residents in Port Jervis, NY compared to nearest cities:
(Note: Based on data for the last 3 years, including only cities with population 5,000 and above)
| Port Jervis: | 37.8 |
| Deerpark: | 1.3 |
| Mount Hope: | 12.8 |
| Middletown: | 60.0 |
| Goshen: | 65.6 |
| Warwick: | 83.0 |
| Monticello: | 17.0 |
| Fallsburg: | 2.6 |
| Monroe: | 267.1 |
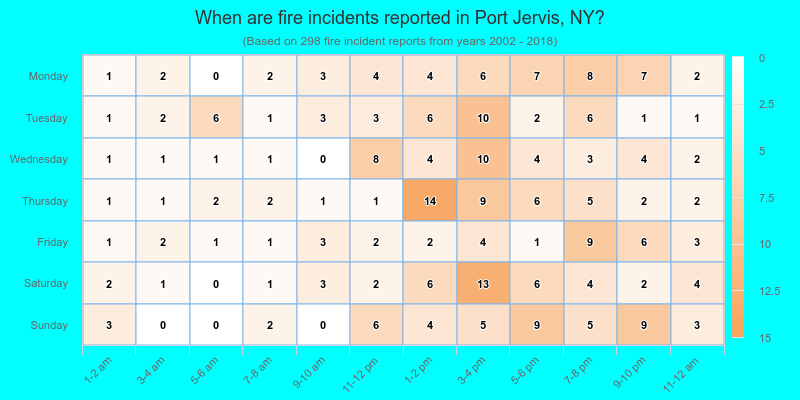
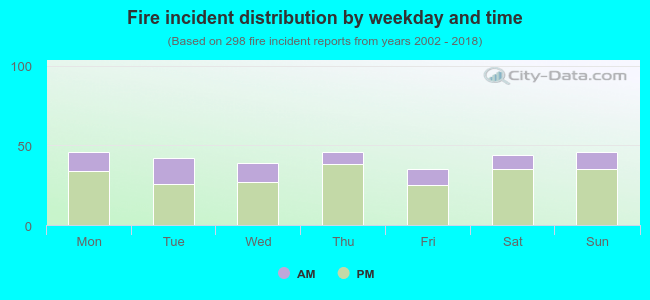 26.2% incidents where reported in the morning and 73.8% in the evening. The most fires (15.4%) took place on Monday, and the least (11.7%) on Friday.
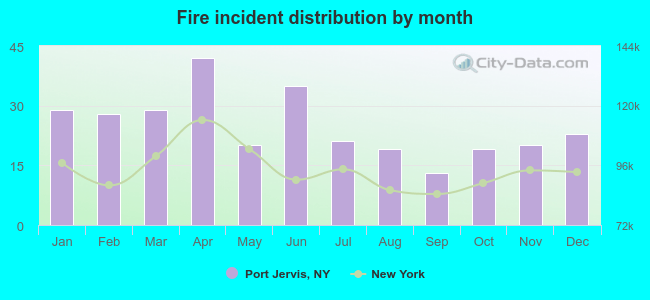 According to the 298 fire incident reports from years 2002 - 2018 most fires (14.1%) took place during April, and the least (4.4%) in September.
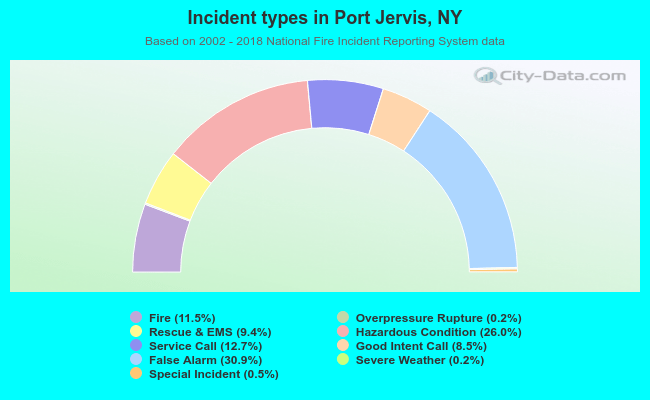 Out of all 2,599 cases reported during the years 2002 - 2018, the most belonged to the categories: False Alarm (30.9%), Hazardous Condition (26.0%), and Service Call (12.7%).
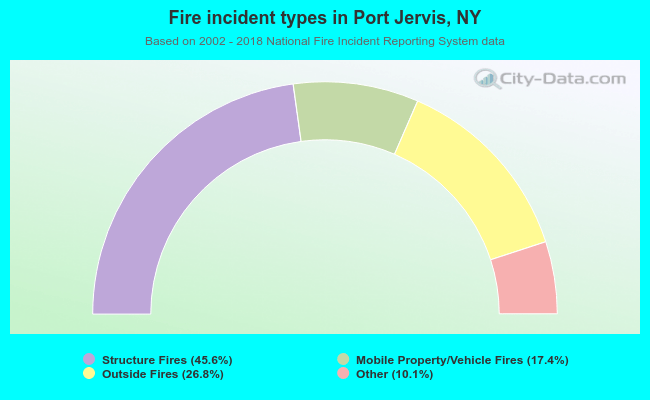 When looking into fire subcategories, the most reports belonged to: Structure Fires (45.6%), and Outside Fires (26.8%).