Port Neches: Fire Incidents, Texas (TX)
Where are fire incidents reported in Port Neches, TX
Something went wrong! Please refresh the page.
| Fire incidents reported | |
|---|---|
| Sreet name | Count |
| PORT NECHES AVE | 78 |
| 8TH ST | 62 |
| NALL ST | 52 |
| MERRIMAN ST | 50 |
| RIDGEWOOD DR | 50 |
| 7TH ST | 36 |
| AVENUE B | 34 |
| DALLAS ST | 32 |
| MAGNOLIA AVE | 32 |
| 10TH ST | 30 |
| LLANO ST | 30 |
| TWIN CITY HWY | 30 |
| 366 HWY | 28 |
| GRIGSBY AVE | 28 |
| WASHINGTON ST | 26 |
| 11TH ST | 24 |
| WAGNER ST | 24 |
| 14TH ST | 22 |
| 1ST ST | 22 |
| AVENUE C | 22 |
| MONTROSE DR | 20 |
| RIDGEWOOD | 20 |
| 6TH ST | 18 |
| MAIN ST | 18 |
| SOUTH AVE | 18 |
| 13TH ST | 16 |
| JOHNSON AVE | 16 |
| 12TH ST | 14 |
| 5TH ST | 14 |
| 8TH | 14 |
| Other | 80 |
2003 - 2018 National Fire Incident Reporting System (NFIRS) incidents
- Incident types reported to NFIRS in Port Neches, TX
- 3,63756.1%Rescue & EMS
- 96014.8%Fire
- 71811.1%Hazardous Condition
- 4426.8%Good Intent Call
- 4116.3%Service Call
- 2914.5%False Alarm
- 200.3%Special Incident
- Fire incident types reported to NFIRS in Port Neches, TX
- 41743.4%Structure Fires
- 38940.5%Outside Fires
- 879.1%Other
- 677.0%Mobile Property/Vehicle Fires
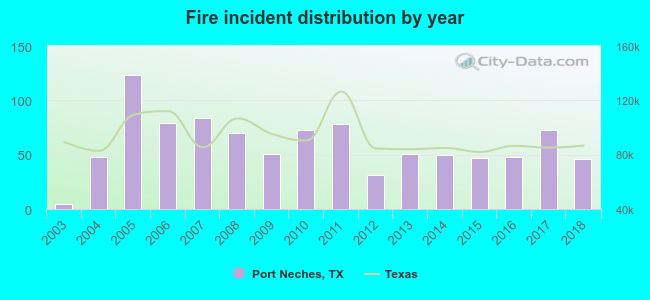 Based on the data from the years 2003 - 2018 the average number of fire incidents per year is 60. The highest number of reported fire incidents - 123 took place in 2005, and the least - 5 in 2003. The data has an increasing trend.
The average number of yearly fire incidents per 10k residents in Port Neches, TX compared to nearest cities:
(Note: Based on data for the last 3 years, including only cities with population 5,000 and above)
| Port Neches: | 43.6 |
| Nederland: | 62.2 |
| Groves: | 63.1 |
| Port Arthur: | 65.2 |
| Bridge City: | 86.7 |
| Vidor: | 261.3 |
| Beaumont: | 45.4 |
| Orange: | 82.5 |
| Lumberton: | 3.5 |
 The median response time based on all reported fire incidents is 5 minutes. This is lower than the Texas median value.
The median response time in Port Neches, TX compared to nearest cities:
(Note: Based on data for all years, including only cities with at least 500 fire incidents)
| Port Neches: | 5 minutes |
| Nederland: | 5 minutes |
| Groves: | 4 minutes |
| Port Arthur: | 4 minutes |
| Bridge City: | 8 minutes |
| Vidor: | 7 minutes |
| Beaumont: | 4 minutes |
| Orange: | 5 minutes |
| Lumberton: | 8 minutes |
 According to the data from the years 2003 - 2018 the average number of fire-related yearly casualties is 1. The highest number of reported casualties - 3 took place in 2005, and the lowest - 0 in 2003. The data has a constant trend.
The average number of injuries per 1,000 fire incidents is 9. This indicator was the highest - 32 in 2012, and the lowest 0 in 2003. The trend for casualties per 1,000 fire incidents is constant. Compared to the state value the number of casualties per 1,000 fires is higher.
According to the data from the years 2003 - 2018 the average number of fire-related yearly casualties is 1. The highest number of reported casualties - 3 took place in 2005, and the lowest - 0 in 2003. The data has a constant trend.
The average number of injuries per 1,000 fire incidents is 9. This indicator was the highest - 32 in 2012, and the lowest 0 in 2003. The trend for casualties per 1,000 fire incidents is constant. Compared to the state value the number of casualties per 1,000 fires is higher.Casualties per 1,000 incidents in Port Neches, TX compared to nearest cities:
(Note: Based on data for all years, including only cities with at least 500 fire incidents)
| Port Neches: | 10.4 |
| Nederland: | 11.5 |
| Groves: | 8.5 |
| Port Arthur: | 5.5 |
| Bridge City: | 0.6 |
| Vidor: | 4.2 |
| Beaumont: | 22.3 |
| Orange: | 6.8 |
| Lumberton: | 1.5 |
 29.9% incidents where reported in the morning and 70.1% in the evening. The most fires (16.5%) took place on Sunday, and the least (13.0%) on Saturday.
 Based on the 960 fire incident reports from years 2003 - 2018 most fires (11.5%) took place during December, and the least (5.6%) in June.
 Out of all 6,482 cases reported during the years 2003 - 2018, the most belonged to the categories: Overpressure Rupture (56.1%), Fire (14.8%), and Rescue & EMS (11.1%).
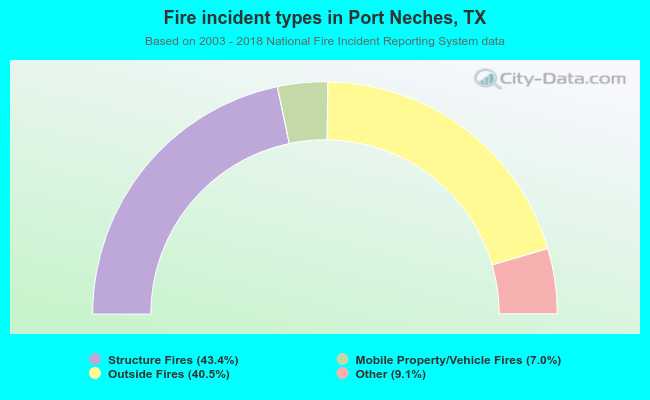 When looking into fire subcategories, the most reports belonged to: Structure Fires (43.4%), and Outside Fires (40.5%).