| Fire incidents reported |
|---|
| Sreet name | Count |
|---|
| SMITH SPRINGS RD | 18 | | HWY 124 | 14 | | LYONS FERRY RD | 6 | | SMITH SPRINGS RD | 6 | | GREENVILLE RD | 4 | | HAIR ROAD | 4 | | HARVEY SHAW RD | 4 | | HIGHWAY 124 | 4 | | MANUAL HOLLOW RD | 4 | | SHEFFLER RD | 4 | | SHEFLER RD | 4 | | SKY ROCKET RD | 4 | | STRUTHERS RD | 4 | | 1111 FISHHOOK PARK RD | 2 | | 1400 BLOCK LYONS FERRY RD | 2 | | 14771 SMITH SPRINGS RD | 2 | | 197 COWELL DR | 2 | | 214 COYOTE LOOP | 2 | | 2ND ST | 2 | | 3554 HARVEY SHAW RD | 2 | | 3890 UPTON RD | 2 | | 4087 SMITH SPRINGS RD | 2 | | 423 BLANCHARD RD | 2 | | 5500 HART ROAD | 2 | | 72 SARA LYNNE LN | 2 |
| | | Fire incidents reported |
|---|
| Sreet name | Count |
|---|
| 76 GRANNY SMITH LN | 2 | | 768 HOFFFMAN RD | 2 | | 8089 CASEY RD | 2 | | 97 LAMAR RD | 2 | | A STREET | 2 | | ADKINS RD AND TOUCHET RIVER NO | 2 | | ATKINS RD | 2 | | AYER JCT | 2 | | AYER RD | 2 | | AYER RD | 2 | | BABCOCK RD | 2 | | BARSTOW RD | 2 | | BARSTOW RD RD | 2 | | BLANCHARD RD | 2 | | BOATERS RAMP AT WALKERS PIT | 2 | | BROTEJE ORCHARDS | 2 | | BROWN RD 3 MI S OF HWY 124 RD | 2 | | CANYON BOTTOM WAY | 2 | | CANYONBOTTOM | 2 | | D ST | 2 | | ELWOOD ELEVATOR | 2 | | ESTES RD | 2 | | ESTES RD AT SMITH SPRINGS | 2 | | EUREKA RD RD | 2 | | |
|
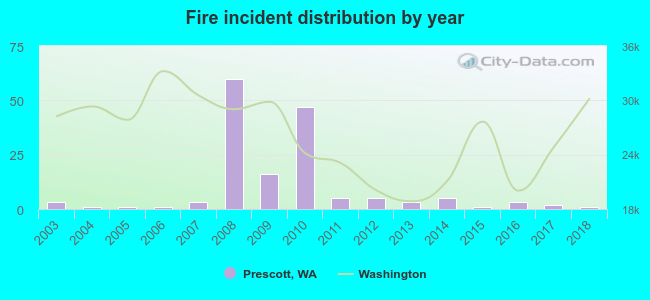 According to the data from the years 2003 - 2018 the average number of fires per year is 10. The highest number of reported fires - 60 took place in 2008, and the least - 1 in 2004. The data has a declining trend.
 19.1% incidents where reported in the morning and 80.9% in the evening. The most fires (19.7%) took place on Thursday, and the least (8.9%) on Sunday.
 According to the 157 fire incidents from years 2003 - 2018 most fires (37.6%) took place during August, and the least (0.0%) in February.
 Out of all 228 cases reported during the years 2003 - 2018, the most belonged to the categories: Fire (68.9%), Overpressure Rupture (23.2%), and Service Call (6.1%).
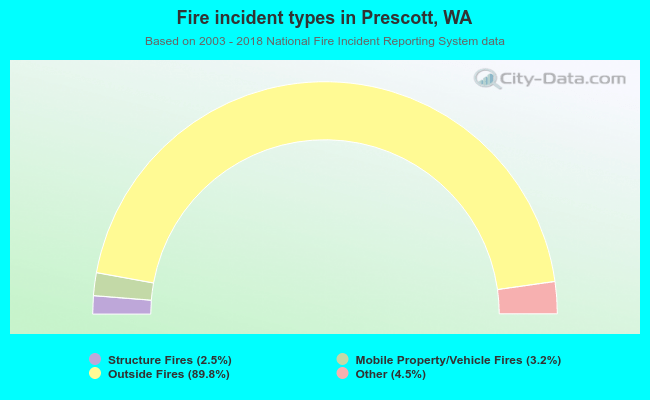 When looking into fire subcategories, the most incidents belonged to: Outside Fires (89.8%), and Other (4.5%).