| Fire incidents reported |
|---|
| Sreet name | Count |
|---|
| HIGHWAY 160 | 8 | | WASHINGTON ST | 6 | | 160 HWY | 4 | | 500 E CEDAR | 4 | | 526 AVE K | 4 | | CEDAR | 4 | | PINE ST | 4 | | 1 MI N OF PROTECTION | 2 | | 1 S 12 W OF RD 2 | 2 | | 1 W OF PROTECTION | 2 | | 100 E MAIN | 2 | | 100 W MAIN | 2 | | 101 BROADWAY | 2 | | 14 M N OF 160 N RD 10 | 2 | | 194 AVE I | 2 | | 1MI W OF PROTECTION | 2 | | 202 N JEFFERSON | 2 | | 209 N BROADWAY | 2 | | 301 AVE B | 2 | | 3056 HIGHWAY 160 | 2 | | 4 12 N OF PROTECTION | 2 | | 402 S WASHINGTON | 2 | | 408 E OAK ST | 2 | | 4M E OF PROTECTION | 2 | | 5 RD | 2 |
| | | Fire incidents reported |
|---|
| Sreet name | Count |
|---|
| 5 RDS | 2 | | 546 AVE M | 2 | | 569 AVE D | 2 | | 7 S OF PROTECTION ON RD 2 | 2 | | 714 RD 3 | 2 | | 8 S 412 W OF PROTECTION | 2 | | 810 AVE Q | 2 | | 949 HWY 160 | 2 | | AVE K | 2 | | AVE M | 2 | | AVE M AND ROAD 7 | 2 | | AVE N AND ROAD 3 | 2 | | AVE O | 2 | | AVE P | 2 | | AVENUE M ROAD 3 | 2 | | BROADWAY AVE | 2 | | CLARKCOM COUNTY LINE | 2 | | CONER OF CHESTNUT MALLIS | 2 | | CR 4 AND AVENUE W | 2 | | CREEK R RD | 2 | | GRANT ST | 2 | | HAYS ST | 2 | | HIGHWAY 160183 | 2 | | HWY 160 | 2 | | |
|
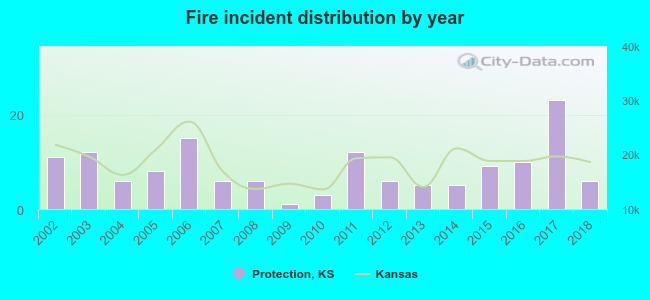 Based on the data from the years 2002 - 2018 the average number of fires per year is 8. The highest number of reported fire incidents - 23 took place in 2017, and the least - 1 in 2009. The data has a dropping trend.
 25.0% incidents where reported in the morning and 75.0% in the evening. The most fires (18.8%) took place on Wednesday, and the least (6.9%) on Thursday.
 Based on the 144 fire incidents from years 2002 - 2018 most fires (13.9%) took place during June, and the least (3.5%) in January.
 Out of all 167 cases reported during the years 2002 - 2018, the most belonged to the categories: Fire (86.2%), Overpressure Rupture (5.4%), and Rescue & EMS (3.6%).
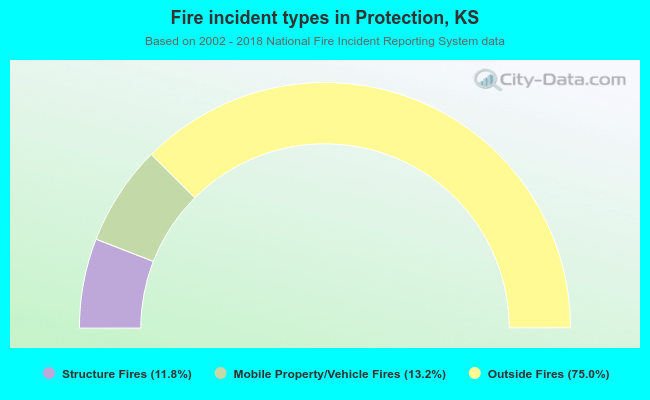 When looking into fire subcategories, the most reports belonged to: Outside Fires (75.0%), and Mobile Property/Vehicle Fires (13.2%).