Rankin: Fire Incidents, Illinois (IL)
Where are fire incidents reported in Rankin, IL
Something went wrong! Please refresh the page.
|
| |||||||||||||||||||||||||||||||||||||||||||||||||||||||||||||||||||||||||||||||||||||||||||||||||||||||||||||
2002 - 2017 National Fire Incident Reporting System (NFIRS) incidents
- Incident types reported to NFIRS in Rankin, IL
- 11047.4%Fire
- 7833.6%Hazardous Condition
- 156.5%Rescue & EMS
- 156.5%Good Intent Call
- 125.2%Service Call
- 20.9%False Alarm
- Fire incident types reported to NFIRS in Rankin, IL
- 7164.5%Outside Fires
- 3229.1%Structure Fires
- 65.5%Mobile Property/Vehicle Fires
- 10.9%Other
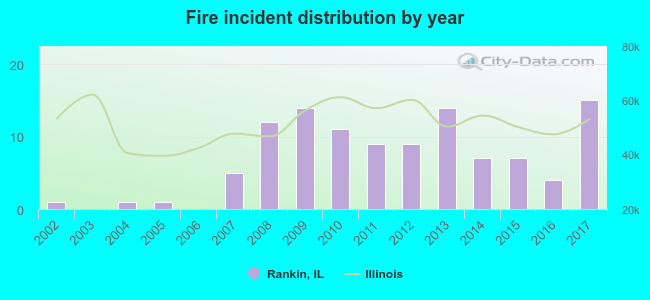 According to the data from the years 2002 - 2017 the average number of fire incidents per year is 7. The highest number of fire incidents - 15 took place in 2017, and the least - 0 in 2003. The data has a growing trend.
 27.3% incidents where reported in the morning and 72.7% in the evening. The most fires (18.2%) took place on Sunday, and the least (10.0%) on Friday.
 Based on the 110 fire incidents from years 2002 - 2017 most fires (16.4%) took place during August, and the least (2.7%) in December.
 Out of all 232 cases reported during the years 2002 - 2017, the most belonged to the categories: Fire (47.4%), Rescue & EMS (33.6%), and Overpressure Rupture (6.5%).
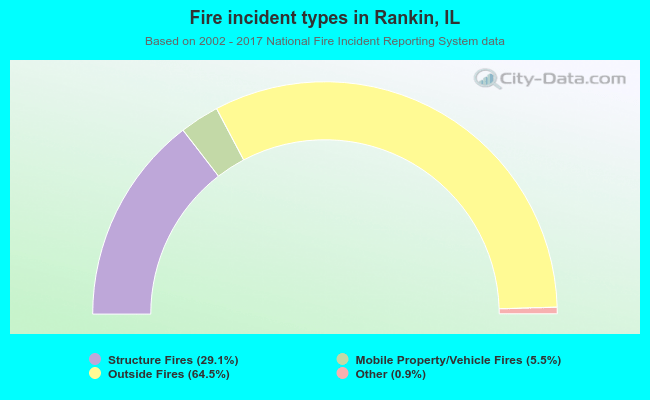 When looking into fire subcategories, the most incidents belonged to: Outside Fires (64.5%), and Structure Fires (29.1%).