Red Hook: Fire Incidents, New York (NY)
Where are fire incidents reported in Red Hook, NY
Something went wrong! Please refresh the page.
|
| |||||||||||||||||||||||||||||||||||||||||||||||||||||||||||||||||||||||||||||||||||||||||||||||||||||||||||||
| Other | 38 | |||||||||||||||||||||||||||||||||||||||||||||||||||||||||||||||||||||||||||||||||||||||||||||||||||||||||||||
2002 - 2018 National Fire Incident Reporting System (NFIRS) incidents
- Incident types reported to NFIRS in Red Hook, NY
- 2,40953.0%Rescue & EMS
- 70415.5%False Alarm
- 55312.2%Hazardous Condition
- 4349.5%Fire
- 3166.9%Good Intent Call
- 932.0%Service Call
- 150.3%Special Incident
- 130.3%Severe Weather
- 120.3%Overpressure Rupture
- Fire incident types reported to NFIRS in Red Hook, NY
- 23754.6%Structure Fires
- 13030.0%Outside Fires
- 4811.1%Mobile Property/Vehicle Fires
- 194.4%Other
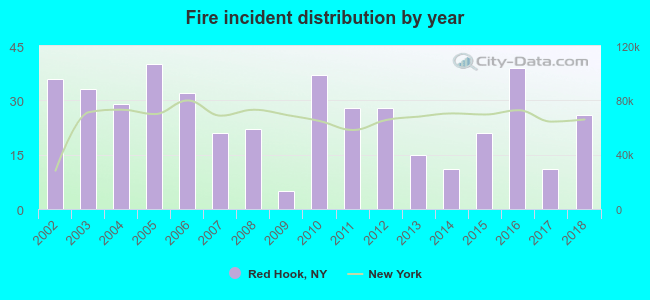 Based on the data from the years 2002 - 2018 the average number of fire incidents per year is 26. The highest number of fire incidents - 40 took place in 2005, and the least - 5 in 2009. The data has a decreasing trend.
 29.0% incidents where reported in the morning and 71.0% in the evening. The most fires (15.4%) took place on Sunday, and the least (11.5%) on Wednesday.
 According to the 434 fire incidents from years 2002 - 2018 most fires (15.0%) took place during April, and the least (2.8%) in June.
 Out of all 4,549 cases reported during the years 2002 - 2018, the most belonged to the categories: Rescue & EMS (53.0%), False Alarm (15.5%), and Hazardous Condition (12.2%).
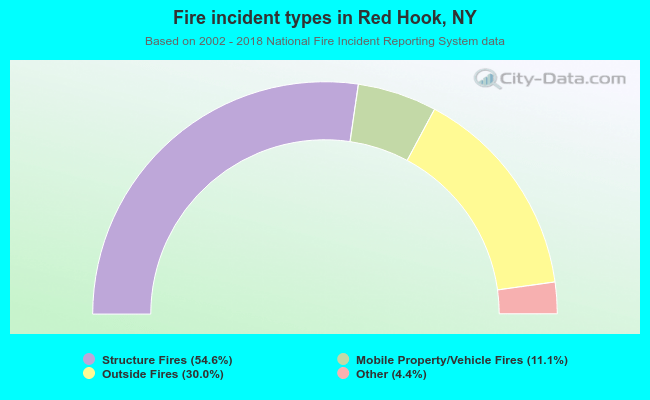 When looking into fire subcategories, the most reports belonged to: Structure Fires (54.6%), and Outside Fires (30.0%).