Red Lodge: Fire Incidents, Montana (MT)
Where are fire incidents reported in Red Lodge, MT
Something went wrong! Please refresh the page.
|
| |||||||||||||||||||||||||||||||||||||||||||||||||||||||||||||||||||||||||||||||||||||||||||||||||||||||||||||
| Other | 91 | |||||||||||||||||||||||||||||||||||||||||||||||||||||||||||||||||||||||||||||||||||||||||||||||||||||||||||||
2003 - 2018 National Fire Incident Reporting System (NFIRS) incidents
- Incident types reported to NFIRS in Red Lodge, MT
- 1,91663.6%Rescue & EMS
- 42914.2%Fire
- 34211.4%Good Intent Call
- 2528.4%Hazardous Condition
- 441.5%False Alarm
- 230.8%Service Call
- 50.2%Special Incident
- Fire incident types reported to NFIRS in Red Lodge, MT
- 27363.6%Outside Fires
- 10825.2%Structure Fires
- 4310.0%Mobile Property/Vehicle Fires
- 51.2%Other
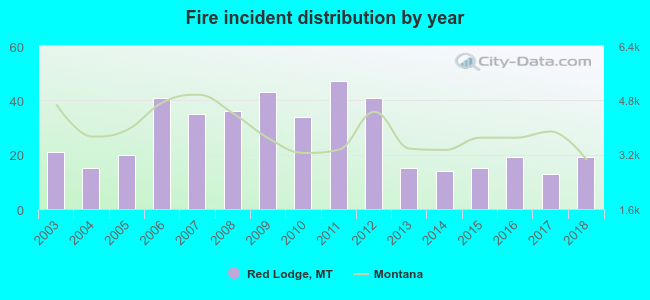 According to the data from the years 2003 - 2018 the average number of fires per year is 27. The highest number of reported fire incidents - 47 took place in 2011, and the least - 13 in 2017. The data has a decreasing trend.
 24.7% incidents where reported in the morning and 75.3% in the evening. The most fires (17.7%) took place on Tuesday, and the least (11.9%) on Thursday.
 Based on the 429 incident reports from years 2003 - 2018 most fires (21.0%) took place during August, and the least (3.5%) in February.
 Out of all 3,012 cases reported during the years 2003 - 2018, the most belonged to the categories: Rescue & EMS (63.6%), Fire (14.2%), and Good Intent Call (11.4%).
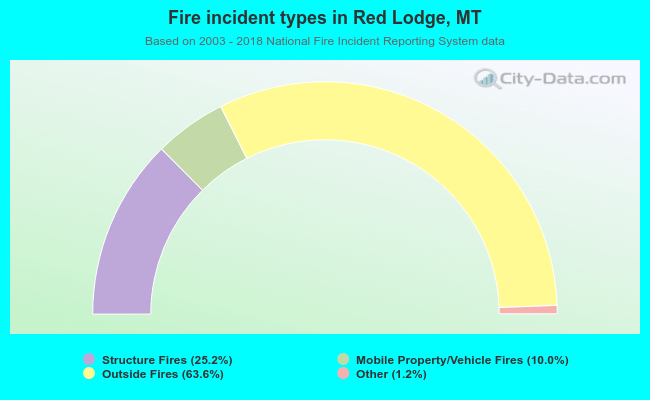 When looking into fire subcategories, the most incidents belonged to: Outside Fires (63.6%), and Structure Fires (25.2%).