Reisterstown: Fire Incidents, Maryland (MD)
Where are fire incidents reported in Reisterstown, MD
Something went wrong! Please refresh the page.
| Fire incidents reported | |
|---|---|
| Sreet name | Count |
| REISTERSTOWN RD | 196 |
| MAIN ST | 80 |
| COCKEYS MILL RD | 56 |
| DEER PARK RD | 50 |
| TARRAGON RD | 50 |
| HANOVER PIKE | 44 |
| OLD HANOVER RD | 36 |
| WESTMINSTER PIKE | 36 |
| WALGROVE RD | 34 |
| CARAWAY RD | 30 |
| SHIRLEY MANOR RD | 30 |
| BROOKEBURY DR | 28 |
| BUTLER RD | 26 |
| CANTATA CT | 26 |
| CHARTLEY DR | 26 |
| GLEN FALLS RD | 24 |
| GLYNDON DR | 24 |
| NICODEMUS RD | 24 |
| BERRYMANS LN | 22 |
| HANOVER RD | 18 |
| MITCHELL DR | 18 |
| CHERRY HILL RD | 16 |
| FRANKLIN*WSTMNSTR PIKE | 16 |
| GORES MILL RD | 16 |
| CHURCH RD | 14 |
| EWING DR | 14 |
| FALLS RD | 14 |
| FRANKLIN BLVD | 14 |
| TROUT BROOK CIR | 14 |
| BONCREST DR | 12 |
| Other | 12 |
2002 - 2018 National Fire Incident Reporting System (NFIRS) incidents
- Incident types reported to NFIRS in Reisterstown, MD
- 11,80464.6%Rescue & EMS
- 2,27812.5%Hazardous Condition
- 1,2056.6%Good Intent Call
- 1,0775.9%Service Call
- 1,0205.6%Fire
- 8594.7%False Alarm
- 190.1%Overpressure Rupture
- Fire incident types reported to NFIRS in Reisterstown, MD
- 51050.0%Outside Fires
- 26526.0%Structure Fires
- 16316.0%Mobile Property/Vehicle Fires
- 828.0%Other
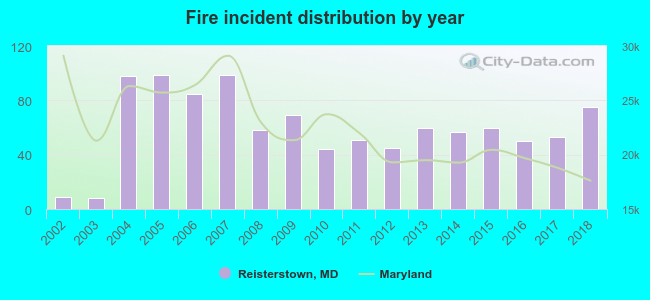 Based on the data from the years 2002 - 2018 the average number of fires per year is 60. The highest number of reported fire incidents - 99 took place in 2005, and the least - 8 in 2003. The data has a growing trend.
The average number of yearly fire incidents per 10k residents in Reisterstown, MD compared to nearest cities:
(Note: Based on data for the last 3 years, including only cities with population 5,000 and above)
| Reisterstown: | 22.8 |
| Owings Mills: | 22.2 |
| Garrison: | 1.1 |
| Randallstown: | 23.4 |
| Pikesville: | 21.3 |
| Eldersburg: | 6.6 |
| Cockeysville: | 26.3 |
| Hampstead: | 91.2 |
| Towson: | 13.6 |
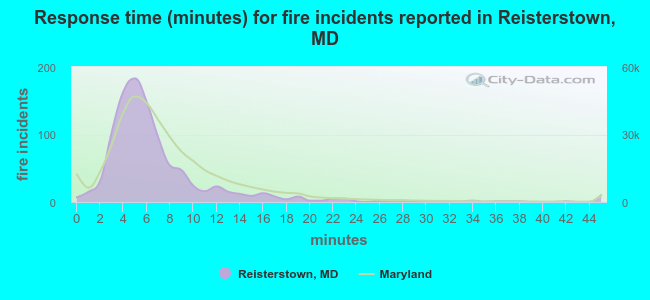 The median response time based on all reported fire incidents is 6 minutes. This is about the same as the state median value.
The median response time in Reisterstown, MD compared to nearest cities:
(Note: Based on data for all years, including only cities with at least 500 fire incidents)
| Reisterstown: | 6 minutes |
| Owings Mills: | 6 minutes |
| Randallstown: | 5 minutes |
| Pikesville: | 5 minutes |
| Eldersburg: | 8 minutes |
| Cockeysville: | 5 minutes |
| Sykesville: | 10 minutes |
| Hampstead: | 10 minutes |
| Towson: | 5 minutes |
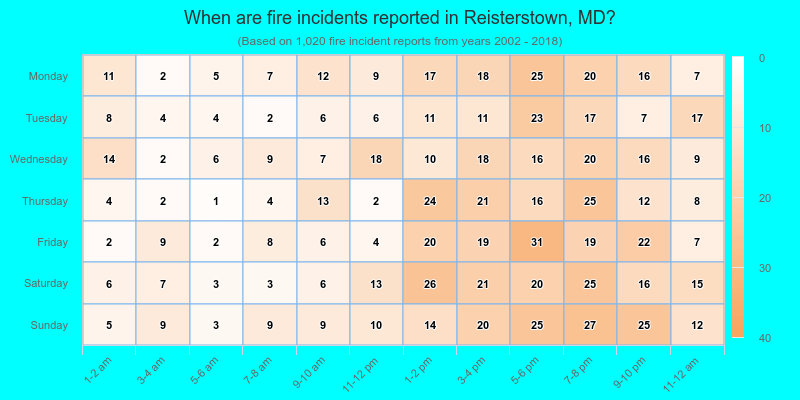
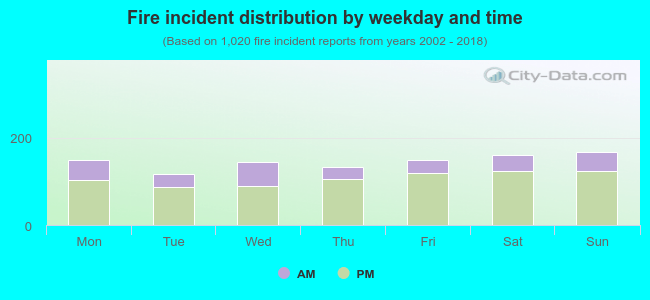 26.7% incidents where reported in the morning and 73.3% in the evening. The most fires (16.5%) took place on Sunday, and the least (11.4%) on Tuesday.
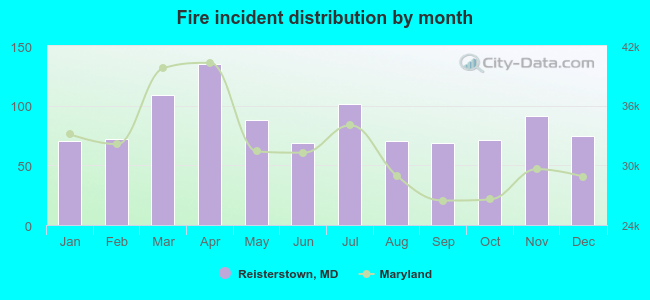 According to the 1,020 reports from years 2002 - 2018 most fires (13.2%) took place during April, and the least (6.8%) in June.
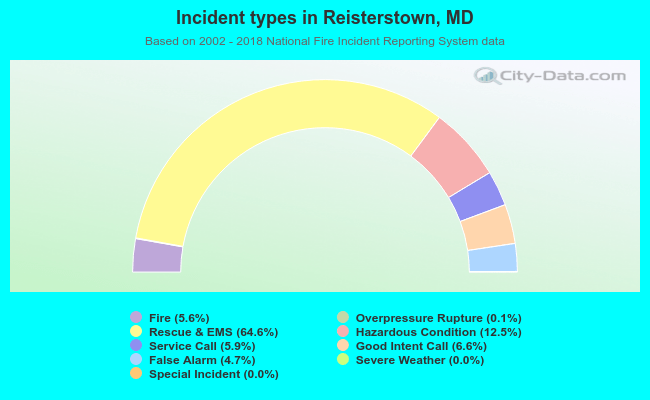 Out of all 18,272 cases reported during the years 2002 - 2018, the most belonged to the categories: Rescue & EMS (64.6%), Hazardous Condition (12.5%), and Good Intent Call (6.6%).
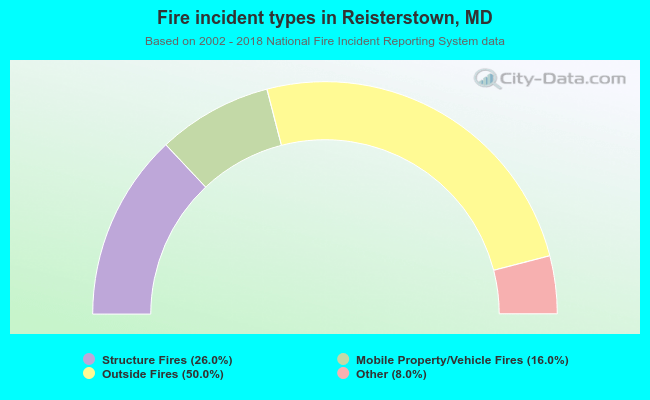 When looking into fire subcategories, the most incidents belonged to: Outside Fires (50.0%), and Structure Fires (26.0%).