Reynolds: Fire Incidents, Indiana (IN)
Where are fire incidents reported in Reynolds, IN
Something went wrong! Please refresh the page.
|
| |||||||||||||||||||||||||||||||||||||||||||||||||||||||||||||||||||||
| Other | 24 | |||||||||||||||||||||||||||||||||||||||||||||||||||||||||||||||||||||
2002 - 2017 National Fire Incident Reporting System (NFIRS) incidents
- Incident types reported to NFIRS in Reynolds, IN
- 15871.8%Fire
- 3013.6%Rescue & EMS
- 135.9%Hazardous Condition
- 62.7%Service Call
- 62.7%False Alarm
- 31.4%Good Intent Call
- 31.4%Severe Weather
- 10.5%Special Incident
- Fire incident types reported to NFIRS in Reynolds, IN
- 6641.8%Outside Fires
- 4528.5%Structure Fires
- 4327.2%Other
- 42.5%Mobile Property/Vehicle Fires
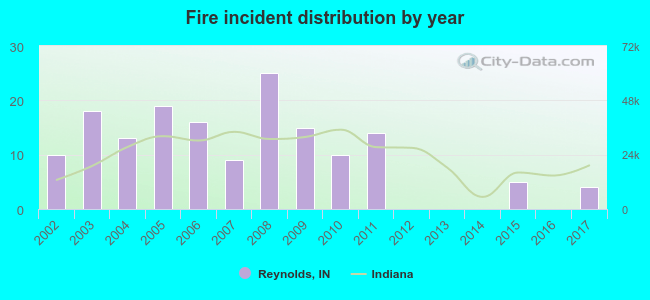 According to the data from the years 2002 - 2017 the average number of fires per year is 10. The highest number of fire incidents - 25 took place in 2008, and the least - 0 in 2012. The data has a dropping trend.
 39.2% incidents where reported in the morning and 60.8% in the evening. The most fires (18.4%) took place on Monday, and the least (7.0%) on Thursday.
 According to the 158 fire incidents from years 2002 - 2017 most fires (15.2%) took place during March, and the least (3.2%) in January.
 Out of all 220 cases reported during the years 2002 - 2017, the most belonged to the categories: Fire (71.8%), Overpressure Rupture (13.6%), and Rescue & EMS (5.9%).
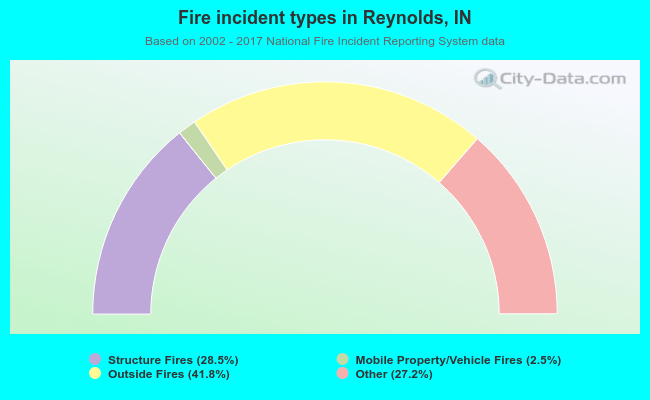 When looking into fire subcategories, the most incidents belonged to: Outside Fires (41.8%), and Structure Fires (28.5%).