Richfield: Fire Incidents, Wisconsin (WI)
Where are fire incidents reported in Richfield, WI
Something went wrong! Please refresh the page.
|
| |||||||||||||||||||||||||||||||||||||||||||||||||||||||||||||||||||||||||||||||||||||||||||||||||||||||||||||
2002 - 2018 National Fire Incident Reporting System (NFIRS) incidents
- Incident types reported to NFIRS in Richfield, WI
- 50863.8%Rescue & EMS
- 15319.2%Fire
- 425.3%Good Intent Call
- 415.2%Hazardous Condition
- 374.6%False Alarm
- 121.5%Service Call
- 20.3%Severe Weather
- 10.1%Overpressure Rupture
- Fire incident types reported to NFIRS in Richfield, WI
- 8253.6%Structure Fires
- 4529.4%Outside Fires
- 2315.0%Mobile Property/Vehicle Fires
- 32.0%Other
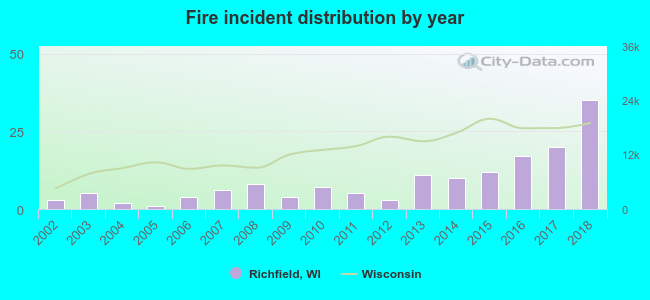 According to the data from the years 2002 - 2018 the average number of fires per year is 9. The highest number of fire incidents - 35 took place in 2018, and the least - 1 in 2005. The data has an increasing trend.
The average number of yearly fire incidents per 10k residents in Richfield, WI compared to nearest cities:
(Note: Based on data for the last 3 years, including only cities with population 5,000 and above)
| Richfield: | 20.9 |
| Germantown: | 31.0 |
| Lisbon: | 3.0 |
| Jackson: | 27.4 |
| Slinger: | 47.0 |
| Sussex: | 23.0 |
| Menomonee Falls: | 22.0 |
| Hartford: | 44.6 |
| Hartland: | 55.8 |
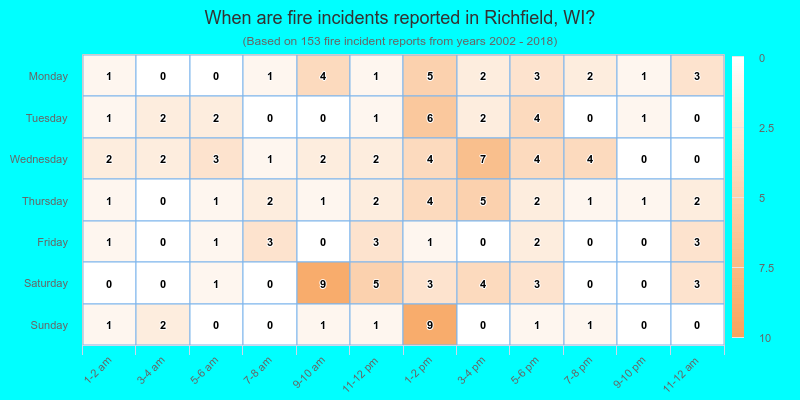
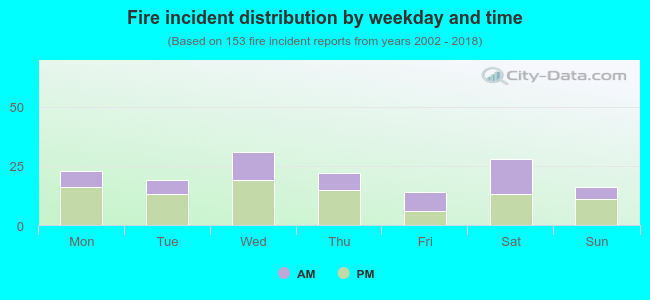 39.2% incidents where reported in the morning and 60.8% in the evening. The most fires (20.3%) took place on Wednesday, and the least (9.2%) on Friday.
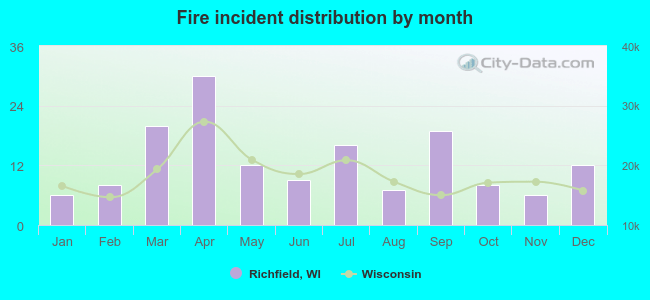 Based on the 153 fire incident reports from years 2002 - 2018 most fires (19.6%) took place during April, and the least (3.9%) in January.
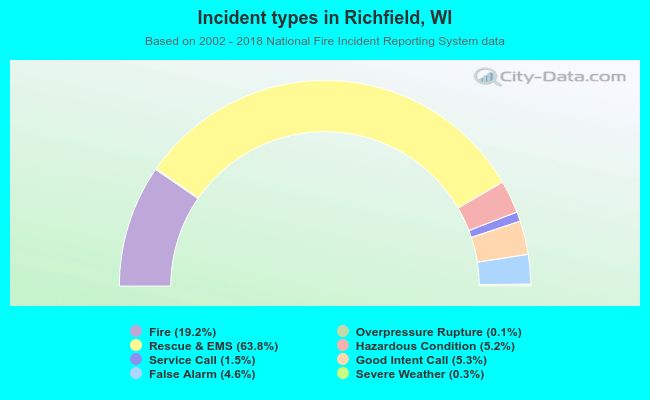 Out of all 796 cases reported during the years 2002 - 2018, the most belonged to the categories: Rescue & EMS (63.8%), Fire (19.2%), and Good Intent Call (5.3%).
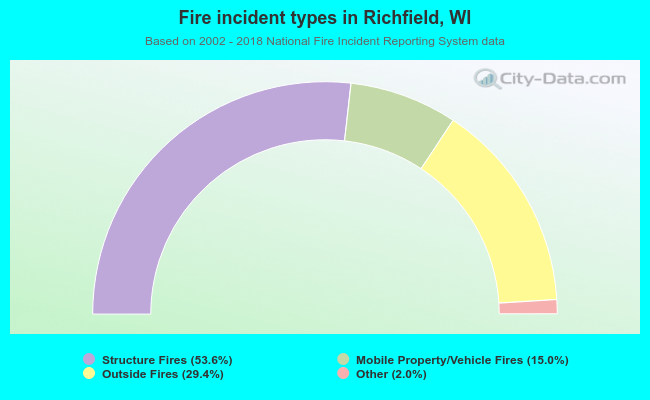 When looking into fire subcategories, the most incidents belonged to: Structure Fires (53.6%), and Outside Fires (29.4%).