Richgrove: Fire Incidents, California (CA)
Where are fire incidents reported in Richgrove, CA
Something went wrong! Please refresh the page.
|
| |||||||||||||||||||||||||||||||||||||||||||||||||||||||||||||||||||||||||||||||||||||||||||||||||||||||||||||
2005 - 2018 National Fire Incident Reporting System (NFIRS) incidents
- Incident types reported to NFIRS in Richgrove, CA
- 27148.2%Rescue & EMS
- 17731.5%Fire
- 478.4%Good Intent Call
- 244.3%Service Call
- 213.7%Hazardous Condition
- 183.2%False Alarm
- 40.7%Special Incident
- Fire incident types reported to NFIRS in Richgrove, CA
- 8045.2%Mobile Property/Vehicle Fires
- 7039.5%Outside Fires
- 1910.7%Structure Fires
- 84.5%Other
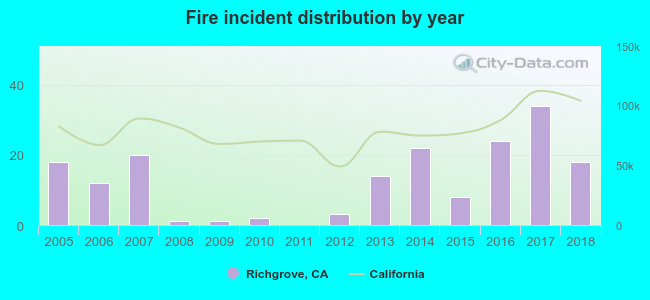 According to the data from the years 2005 - 2018 the average number of fires per year is 13. The highest number of reported fires - 34 took place in 2017, and the least - 0 in 2011. The data has a constant trend.
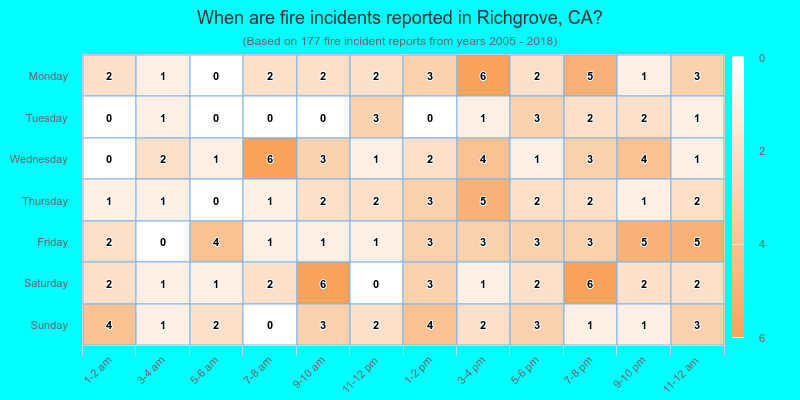
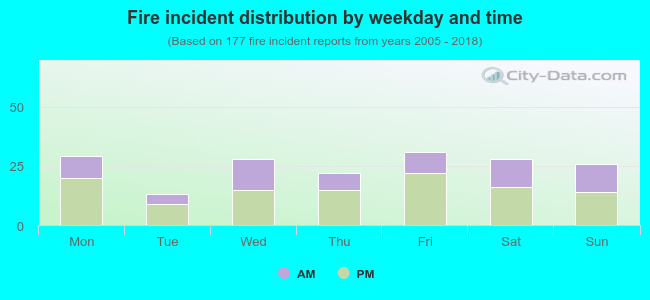 37.3% incidents where reported in the morning and 62.7% in the evening. The most fires (17.5%) took place on Friday, and the least (7.3%) on Tuesday.
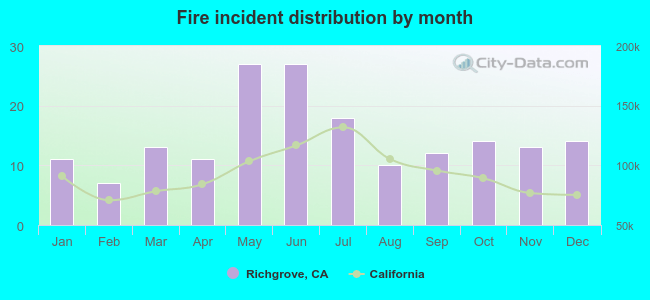 According to the 177 incident reports from years 2005 - 2018 most fires (15.3%) took place during May, and the least (4.0%) in February.
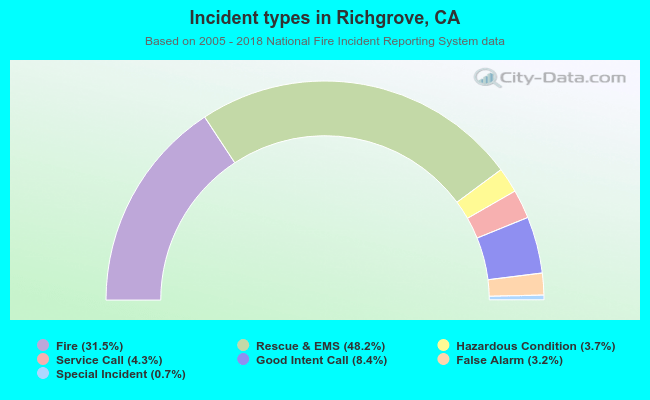 Out of all 562 cases reported during the years 2005 - 2018, the most belonged to the categories: Overpressure Rupture (48.2%), Fire (31.5%), and Service Call (8.4%).
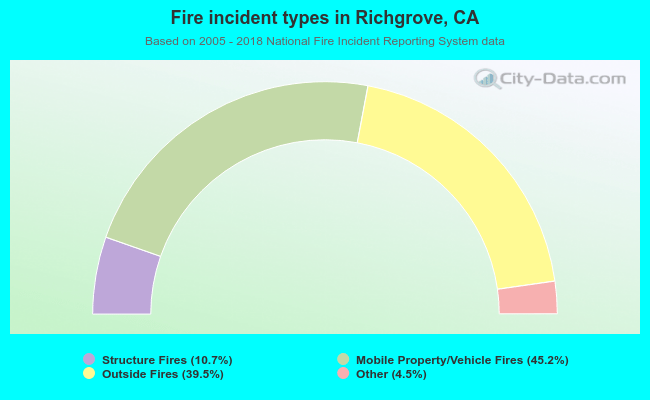 When looking into fire subcategories, the most reports belonged to: Mobile Property/Vehicle Fires (45.2%), and Outside Fires (39.5%).