Richland Center: Fire Incidents, Wisconsin (WI)
Where are fire incidents reported in Richland Center, WI
Something went wrong! Please refresh the page.
|
| |||||||||||||||||||||||||||||||||||||||||||||||||||||||||||||||||||||||||||||||||||||||||||||||||||||||||||||
| Other | 88 | |||||||||||||||||||||||||||||||||||||||||||||||||||||||||||||||||||||||||||||||||||||||||||||||||||||||||||||
2004 - 2018 National Fire Incident Reporting System (NFIRS) incidents
- Incident types reported to NFIRS in Richland Center, WI
- 42041.3%Hazardous Condition
- 34433.8%Fire
- 868.5%Rescue & EMS
- 757.4%False Alarm
- 706.9%Good Intent Call
- 161.6%Service Call
- 40.4%Severe Weather
- 20.2%Special Incident
- Fire incident types reported to NFIRS in Richland Center, WI
- 17550.9%Structure Fires
- 9026.2%Outside Fires
- 7421.5%Mobile Property/Vehicle Fires
- 51.5%Other
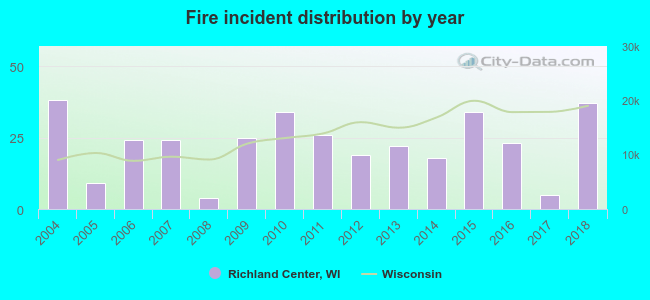 According to the data from the years 2004 - 2018 the average number of fires per year is 23. The highest number of fire incidents - 38 took place in 2004, and the least - 4 in 2008. The data has a decreasing trend.
The average number of yearly fire incidents per 10k residents in Richland Center, WI compared to nearest cities:
(Note: Based on data for the last 3 years, including only cities with population 5,000 and above)
| Richland Center: | 42.8 |
| Reedsburg: | 17.1 |

 Based on the data from the years 2004 - 2018 the average number of fire-related casualties per year is 0. The highest number of reported casualties - 2 took place in 2004, and the lowest - 0 in 2005. The data has a declining trend.
 33.4% incidents where reported in the morning and 66.6% in the evening. The most fires (17.4%) took place on Tuesday, and the least (9.6%) on Friday.
 According to the 344 incident reports from years 2004 - 2018 most fires (13.7%) took place during April, and the least (5.2%) in August.
 Out of all 1,017 cases reported during the years 2004 - 2018, the most belonged to the categories: Rescue & EMS (41.3%), Fire (33.8%), and Overpressure Rupture (8.5%).
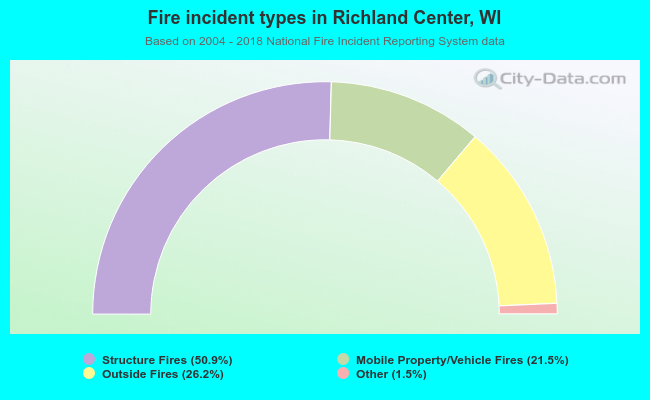 When looking into fire subcategories, the most reports belonged to: Structure Fires (50.9%), and Outside Fires (26.2%).