Richlands: Fire Incidents, Virginia (VA)
Where are fire incidents reported in Richlands, VA
Something went wrong! Please refresh the page.
|
| |||||||||||||||||||||||||||||||||||||||||||||||||||||||||||||||||||||||||||||||||||||||||||||||||||||||||||||
2002 - 2018 National Fire Incident Reporting System (NFIRS) incidents
- Incident types reported to NFIRS in Richlands, VA
- 57047.9%Hazardous Condition
- 27623.2%Fire
- 18815.8%Rescue & EMS
- 978.2%Good Intent Call
- 272.3%False Alarm
- 211.8%Service Call
- 90.8%Severe Weather
- Fire incident types reported to NFIRS in Richlands, VA
- 15355.4%Structure Fires
- 8430.4%Outside Fires
- 3512.7%Mobile Property/Vehicle Fires
- 41.4%Other
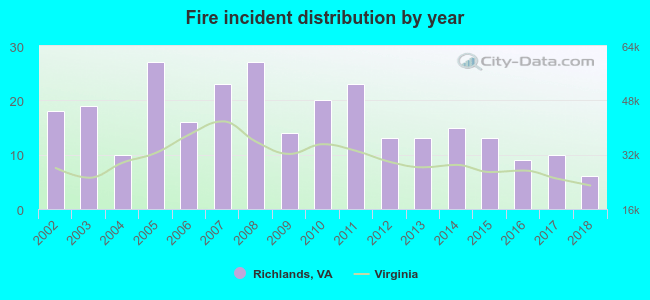 Based on the data from the years 2002 - 2018 the average number of fire incidents per year is 16. The highest number of reported fires - 27 took place in 2005, and the least - 6 in 2018. The data has a dropping trend.

 Based on the data from the years 2002 - 2018 the average number of fire-related fatalities per year is 0. The highest number of deaths - 1 took place in 2003, and the lowest - 0 in 2002. The data has a constant trend.
 According to the reports from the years 2002 - 2018 the average number of fire-related yearly casualties is 0. The highest number of injuries - 2 took place in 2010, and the lowest - 0 in 2002. The data has a constant trend.
 27.2% incidents where reported in the morning and 72.8% in the evening. The most fires (16.7%) took place on Saturday, and the least (12.0%) on Monday.
 Based on the 276 reports from years 2002 - 2018 most fires (14.5%) took place during February, and the least (4.3%) in May.
 Out of all 1,190 cases reported during the years 2002 - 2018, the most belonged to the categories: Hazardous Condition (47.9%), Fire (23.2%), and Rescue & EMS (15.8%).
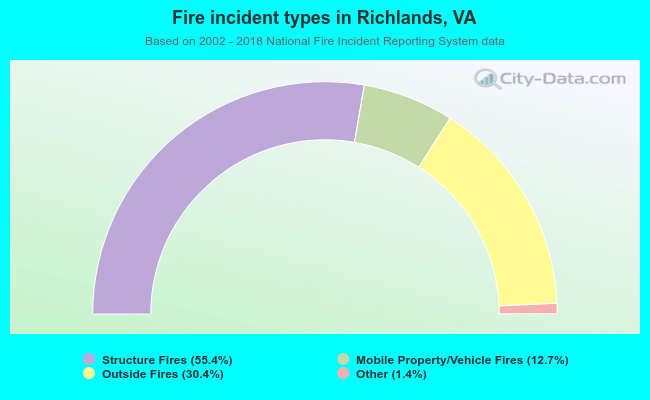 When looking into fire subcategories, the most incidents belonged to: Structure Fires (55.4%), and Outside Fires (30.4%).