| Fire incidents reported |
|---|
| Sreet name | Count |
|---|
| MADISON RD | 40 | | FAIRVIEW CHURCH RD | 38 | | WALNUT CREEK RD | 24 | | ANDERSON AVE | 18 | | FALCON RD | 18 | | MAIN ST | 16 | | BROADWAY ST | 14 | | HOMESTEAD RD | 14 | | KANSAS AVE | 12 | | NOBLE ST | 12 | | TUTTLE CREEK BLVD | 12 | | 60TH ST | 10 | | BILLINGS ST | 10 | | CAVALRY RD | 10 | | REMMELE ST | 10 | | BLUE RIVER HILLS RD | 8 | | WALNUT ST | 8 | | 52ND ST | 6 | | CHESTNUT ST | 6 | | LAKE ST | 6 | | MADISON CREEK RD | 6 | | ALEMBIC RD | 4 | | BALA (RC 396W) RD | 4 | | CALVARY RD | 4 | | CROOKED CREEK RD | 4 |
| | | Fire incidents reported |
|---|
| Sreet name | Count |
|---|
| HIGH ST | 4 | | IOWA ST | 4 | | POWYS LN | 4 | | RILEY ST | 4 | | UNION RD | 4 | | ALERT RD | 2 | | ANDERSON AVENUE (RC 412) | 2 | | BALDWIN PARK RD | 2 | | BLK N NOBLE ST | 2 | | CALAVARY RD | 2 | | CLAY ST | 2 | | CONDRAY RD | 2 | | COUNTRY RD | 2 | | CROOKED CEDAR LN | 2 | | ELM ST | 2 | | JENKINS RD | 2 | | KITTEN CREEK RD | 2 | | LASITA RD | 2 | | LKW RD | 2 | | MADISON | 2 | | MARIE LN | 2 | | N 63RD AVE | 2 | | PRAIRIE COUNTRY LN | 2 | | STOCKDALE PARK RD | 2 | | |
|
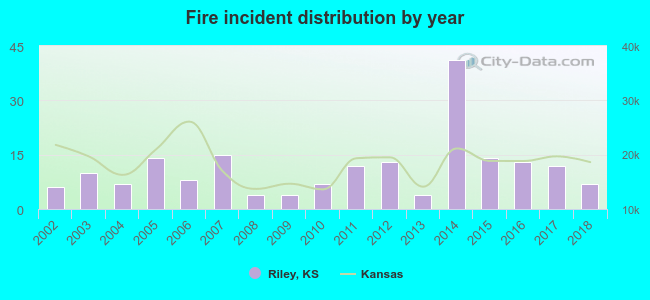 Based on the data from the years 2002 - 2018 the average number of fire incidents per year is 11. The highest number of fire incidents - 41 took place in 2014, and the least - 4 in 2008. The data has an increasing trend.
 18.3% incidents where reported in the morning and 81.7% in the evening. The most fires (18.8%) took place on Tuesday, and the least (10.5%) on Monday.
 Based on the 191 reports from years 2002 - 2018 most fires (27.2%) took place during March, and the least (3.1%) in September.
 Out of all 594 cases reported during the years 2002 - 2018, the most belonged to the categories: Overpressure Rupture (36.9%), Fire (32.2%), and Rescue & EMS (12.3%).
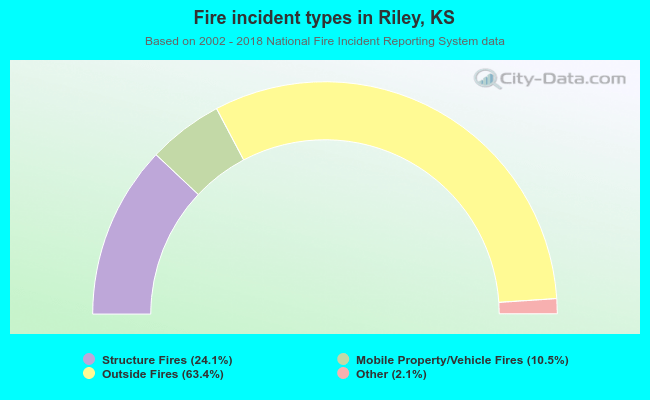 When looking into fire subcategories, the most incidents belonged to: Outside Fires (63.4%), and Structure Fires (24.1%).