| Fire incidents reported |
|---|
| Sreet name | Count |
|---|
| MAIN ST | 26 | | ARISTES RD | 14 | | RINGTOWN BLVD | 14 | | MAIN STREET | 12 | | ARISTES ROAD | 8 | | MAIN | 8 | | PATTERSONVILLE (30) RD | 8 | | PATTERSONVILLE RD | 8 | | POLE RD | 8 | | SHENANDOAH RD | 8 | | BRANDONVILLE RD | 6 | | MAIN BLVD | 6 | | TRAILER RD | 6 | | CENTER ST | 4 | | MAIN BLVD. | 4 | | MELANIE MANOR | 4 | | MURRY MEADOWS (30) RD | 4 | | PHINEYVILLE RD. | 4 | | PINE SWAMP RD | 4 | | PUMP HOUSE LN | 4 | | PUMPING STATION RD | 4 | | SHEN. MT. ROAD | 4 | | STRAWBERRY LN | 4 | | ZION GROVE RD | 4 | | 4TH | 2 |
| | | Fire incidents reported |
|---|
| Sreet name | Count |
|---|
| 4TH STREET | 2 | | 6TH ST | 2 | | ARISTES (30) RD | 2 | | ARISTES RD | 2 | | ARISTIS RD | 2 | | BRANDONVILLE (30) RD | 2 | | CENTRE | 2 | | FARMERS RD | 2 | | FERNDALE RD | 2 | | GREEN MOUNTAIN RD | 2 | | HOLLOW | 2 | | JERRY'S RD | 2 | | KUNKELS HILL (09) RD | 2 | | LEACH RD | 2 | | LEX LA | 2 | | LINDEN LN | 2 | | LINDER LANE | 2 | | LINDER LN | 2 | | LUMPY (30) LA | 2 | | LUMPY LANE | 2 | | MAHANOY STA | 2 | | MELANIE MANER | 2 | | MELANIE MANOR LN | 2 | | MELANIE MANOR RD | 2 | | |
|
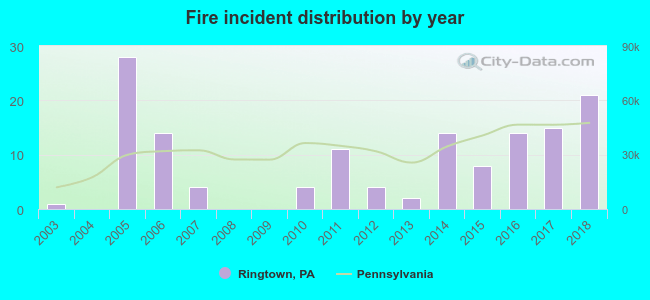 Based on the data from the years 2003 - 2018 the average number of fires per year is 9. The highest number of fires - 28 took place in 2005, and the least - 0 in 2004. The data has a growing trend.
 31.4% incidents where reported in the morning and 68.6% in the evening. The most fires (20.7%) took place on Saturday, and the least (8.6%) on Monday.
 According to the 140 fires from years 2003 - 2018 most fires (17.1%) took place during May, and the least (2.9%) in December.
 Out of all 313 cases reported during the years 2003 - 2018, the most belonged to the categories: Fire (44.7%), Good Intent Call (16.0%), and Hazardous Condition (15.3%).
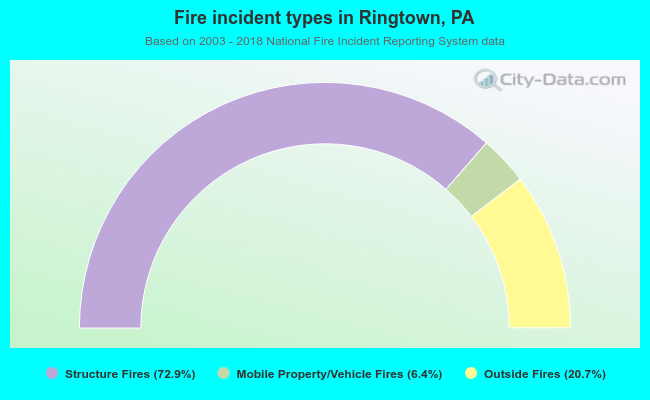 When looking into fire subcategories, the most incidents belonged to: Structure Fires (72.9%), and Outside Fires (20.7%).