| Fire incidents reported |
|---|
| Sreet name | Count |
|---|
| 2350N | 8 | | 364 KNOX HWY 35 | 6 | | 2800 KNOX RD RD | 4 | | 2845 KNOX RD 500E | 4 | | 315 SUNSHINE DRIVE | 4 | | HENDERSON TRAIL | 4 | | HINCHLIFF | 4 | | 000E | 2 | | 105 KNOXVILLE TRAIL | 2 | | 105 MAIN ST | 2 | | 105 US HWY 150 N | 2 | | 110 HINCHLIFF STREET | 2 | | 114 N MAIN ST | 2 | | 157 KNOX HWY 34 | 2 | | 170 MOSHIER HILL | 2 | | 200 BLK OF 2550 N | 2 | | 200 CENTER AVE | 2 | | 200 E 2500 N | 2 | | 201 W SAUK STREET | 2 | | 202 E GRAND | 2 | | 207 N MAIN | 2 | | 207 N MAIN ST | 2 | | 214 E MAIN ST | 2 | | 220 KNOX RD 2450 FLD | 2 | | 2300 KNOX RD 700E | 2 |
| | | Fire incidents reported |
|---|
| Sreet name | Count |
|---|
| 233 HINCHLIFF | 2 | | 2350 165E | 2 | | 2350E | 2 | | 2350N US 150N | 2 | | 240 KNOX RD 2500 | 2 | | 2435 000E | 2 | | 2435 WEST KNOX RD | 2 | | 2450 500E | 2 | | 2450 KNOX RD 220 EAST | 2 | | 2450 US HWY 150 | 2 | | 2471 HENDERSON TRAIL | 2 | | 2475 KNOX RD 500E | 2 | | 2495 HENDERSON TRAIL | 2 | | 2500 KNOX ROAD 500 EAST | 2 | | 2500 N | 2 | | 2512 KNOX RD 500E | 2 | | 2518 KNOX RD 400E | 2 | | 2550 200E | 2 | | 2550 KNOX RD | 2 | | 2550 US 150 | 2 | | 2550 US 150N | 2 | | 2550N 200E | 2 | | 256 KNOX RD 2350N | 2 | | 2563 US HWY 150 N | 2 | | 2640 KNOX 100E | 2 |
|
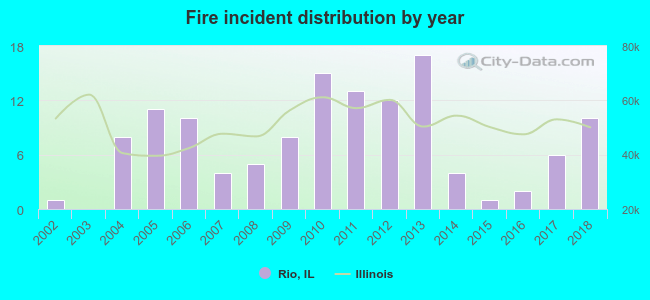 Based on the data from the years 2002 - 2018 the average number of fires per year is 7. The highest number of reported fire incidents - 17 took place in 2013, and the least - 0 in 2003. The data has a growing trend.
 22.8% incidents where reported in the morning and 77.2% in the evening. The most fires (23.6%) took place on Friday, and the least (9.4%) on Sunday.
 According to the 127 fire incidents from years 2002 - 2018 most fires (20.5%) took place during April, and the least (3.1%) in July.
 Out of all 306 cases reported during the years 2002 - 2018, the most belonged to the categories: Fire (41.5%), Overpressure Rupture (39.5%), and Rescue & EMS (8.5%).
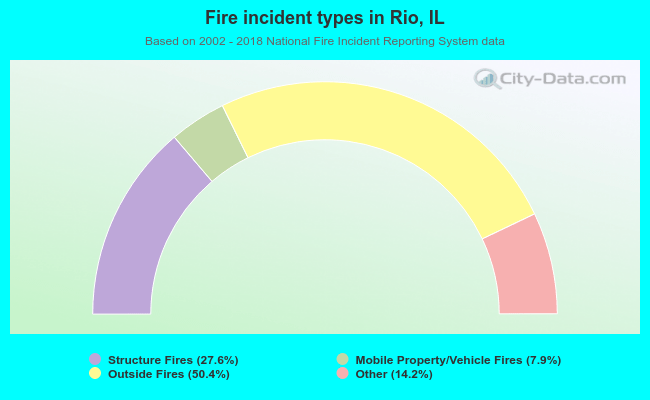 When looking into fire subcategories, the most reports belonged to: Outside Fires (50.4%), and Structure Fires (27.6%).