Rio Linda: Fire Incidents, California (CA)
Where are fire incidents reported in Rio Linda, CA
Something went wrong! Please refresh the page.
| Fire incidents reported | |
|---|---|
| Sreet name | Count |
| DRY CREEK RD | 132 |
| 6TH ST | 118 |
| ELKHORN | 78 |
| 2ND ST | 66 |
| ELKHORN BL | 66 |
| E ST | 64 |
| G ST | 62 |
| 20TH ST | 60 |
| ASCOT AV | 46 |
| ELVERTA RD | 46 |
| MARYSVILLE BL | 44 |
| 10TH ST | 42 |
| LEVEE RD | 36 |
| MARYSVILLE | 36 |
| 4TH ST | 34 |
| 16TH ST | 32 |
| CHERRY LN | 32 |
| FRONT ST | 32 |
| M ST | 32 |
| RIO LINDA | 30 |
| 18TH ST | 28 |
| RIO LINDA BL | 28 |
| 7TH ST | 26 |
| 8TH ST | 26 |
| Q ST | 26 |
| U ST | 26 |
| C ST | 22 |
| BLACKTOP RD | 20 |
| CURVED BRIDGE RD | 20 |
| I ST | 20 |
2005 - 2018 National Fire Incident Reporting System (NFIRS) incidents
- Incident types reported to NFIRS in Rio Linda, CA
- 3,86260.9%Rescue & EMS
- 86813.7%Fire
- 65810.4%Good Intent Call
- 4847.6%Service Call
- 1933.0%Hazardous Condition
- 1392.2%False Alarm
- 1352.1%Special Incident
- Fire incident types reported to NFIRS in Rio Linda, CA
- 53661.8%Outside Fires
- 17119.7%Structure Fires
- 11613.4%Mobile Property/Vehicle Fires
- 455.2%Other
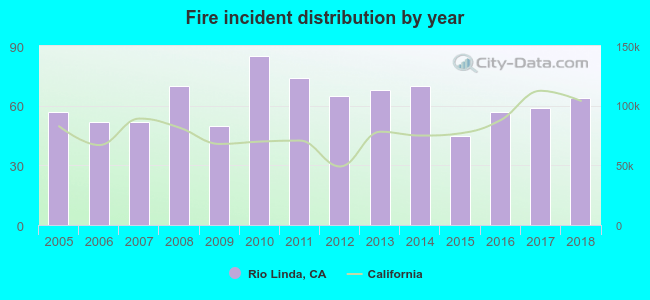 According to the data from the years 2005 - 2018 the average number of fire incidents per year is 62. The highest number of reported fires - 85 took place in 2010, and the least - 45 in 2015. The data has a growing trend.
The average number of yearly fire incidents per 10k residents in Rio Linda, CA compared to nearest cities:
(Note: Based on data for the last 3 years, including only cities with population 5,000 and above)
| Rio Linda: | 39.7 |
| Elverta: | 94.1 |
| North Highlands: | 46.8 |
| Antelope: | 11.7 |
| Carmichael: | 16.0 |
| Citrus Heights: | 28.1 |
| Sacramento: | 69.5 |
| West Sacramento: | 58.9 |
| Roseville: | 22.8 |
 The median response time based on all reported fire incidents is 5 minutes. This is lower compared to the state median value.
The median response time in Rio Linda, CA compared to nearest cities:
(Note: Based on data for all years, including only cities with at least 500 fire incidents)
| Rio Linda: | 5 minutes |
| Elverta: | 6 minutes |
| North Highlands: | 5 minutes |
| Antelope: | 5 minutes |
| Carmichael: | 5 minutes |
| Citrus Heights: | 5 minutes |
| Sacramento: | 5 minutes |
| West Sacramento: | 5 minutes |
| Roseville: | 5 minutes |
 34.3% incidents where reported in the morning and 65.7% in the evening. The most fires (16.1%) took place on Sunday, and the least (12.2%) on Thursday.
 According to the 868 fires from years 2005 - 2018 most fires (18.7%) took place during July, and the least (4.6%) in February.
 Out of all 6,341 cases reported during the years 2005 - 2018, the most belonged to the categories: Rescue & EMS (60.9%), Fire (13.7%), and Good Intent Call (10.4%).
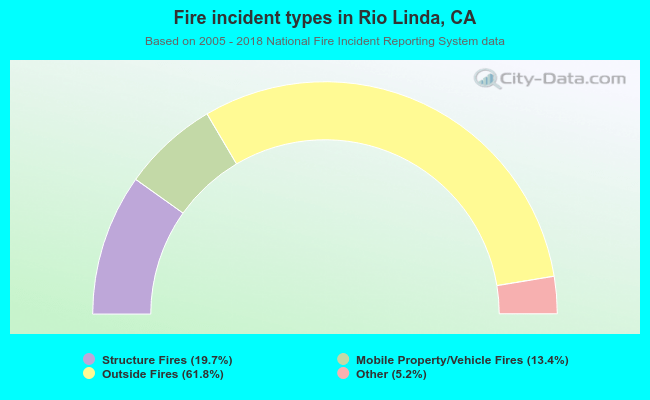 When looking into fire subcategories, the most incidents belonged to: Outside Fires (61.8%), and Structure Fires (19.7%).