Robbinsville: Fire Incidents, New Jersey (NJ)
Where are fire incidents reported in Robbinsville, NJ
Something went wrong! Please refresh the page.
| Fire incidents reported | |
|---|---|
| Sreet name | Count |
| NEW JERSEY TPKE | 288 |
| ROUTE 130 | 158 |
| WASHINGTON BLVD | 134 |
| APPLEGATE DR | 84 |
| INTERSTATE 195 | 74 |
| ROUTE 33 | 70 |
| WYNDHAM PL | 64 |
| SHARON RD | 62 |
| ROBBINSVILLE ALLENTOWN RD | 60 |
| ANDOVER PL | 58 |
| GORDON RD | 58 |
| MAIN ST | 50 |
| NJTP | 50 |
| ROBBINSVILLE EDINBURG RD | 46 |
| NEW JERSEY TURNPIKE | 38 |
| HILLTOP PL | 36 |
| WALDEN CIR | 34 |
| HUTCHINSON RD | 24 |
| RICHARDSON RD | 24 |
| WEST MANOR WAY | 22 |
| NJ TURNPIKE TPKE | 20 |
| UNION ST | 20 |
| WINDSOR RD | 20 |
| LINE RD | 18 |
| MANOR WAY | 18 |
| NEW CANTON WAY | 18 |
| TINDALL RD | 18 |
| CIRCLE DR | 16 |
| JONATHAN DR | 16 |
| OAK ST | 16 |
2002 - 2018 National Fire Incident Reporting System (NFIRS) incidents
- Incident types reported to NFIRS in Robbinsville, NJ
- 2,40130.7%Rescue & EMS
- 1,44818.5%Good Intent Call
- 1,44618.5%False Alarm
- 1,28116.4%Fire
- 97512.5%Hazardous Condition
- 2373.0%Service Call
- 100.1%Overpressure Rupture
- Fire incident types reported to NFIRS in Robbinsville, NJ
- 61748.2%Structure Fires
- 35627.8%Mobile Property/Vehicle Fires
- 29623.1%Outside Fires
- 120.9%Other
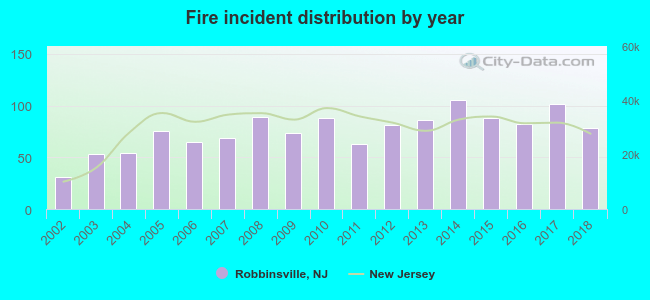 Based on the data from the years 2002 - 2018 the average number of fire incidents per year is 75. The highest number of reported fires - 105 took place in 2014, and the least - 31 in 2002. The data has an increasing trend.
 The median response time based on all reported fire incidents is 5 minutes. This is similar to the New Jersey median value.
The median response time in Robbinsville, NJ compared to nearest cities:
(Note: Based on data for all years, including only cities with at least 500 fire incidents)
| Robbinsville: | 5 minutes |
| Bordentown: | 7 minutes |
| Trenton: | 4 minutes |
| Cranbury: | 7 minutes |
| Lawrenceville: | 7 minutes |
| Ewing: | 6 minutes |
| Princeton: | 8 minutes |
| Florence: | 8 minutes |
| Pennington: | 7 minutes |
 Based on the data from the years 2002 - 2018 the average number of fire-related casualties per year is 0. The highest number of injuries - 2 took place in 2007, and the lowest - 0 in 2002. The data has a constant trend.
The average number of casualties per 1,000 fires is 3. This indicator was the highest - 29 in 2007, and the lowest 0 in 2002. The trend for casualties per 1,000 incidents is constant. Compared to the state value the number of casualties per 1,000 fires is much lower.
Based on the data from the years 2002 - 2018 the average number of fire-related casualties per year is 0. The highest number of injuries - 2 took place in 2007, and the lowest - 0 in 2002. The data has a constant trend.
The average number of casualties per 1,000 fires is 3. This indicator was the highest - 29 in 2007, and the lowest 0 in 2002. The trend for casualties per 1,000 incidents is constant. Compared to the state value the number of casualties per 1,000 fires is much lower.Casualties per 1,000 incidents in Robbinsville, NJ compared to nearest cities:
(Note: Based on data for all years, including only cities with at least 500 fire incidents)
| Robbinsville: | 3.1 |
| Bordentown: | 0.0 |
| Trenton: | 9.2 |
| Cranbury: | 0.0 |
| Lawrenceville: | 9.6 |
| Ewing: | 3.4 |
| Princeton: | 9.0 |
| Florence: | 9.5 |
| Pennington: | 2.9 |
 30.3% incidents where reported in the morning and 69.7% in the evening. The most fires (16.4%) took place on Sunday, and the least (12.8%) on Monday.
 Based on the 1,281 fire incident reports from years 2002 - 2018 most fires (12.3%) took place during May, and the least (5.9%) in September.
 Out of all 7,809 cases reported during the years 2002 - 2018, the most belonged to the categories: Rescue & EMS (30.7%), Good Intent Call (18.5%), and False Alarm (18.5%).
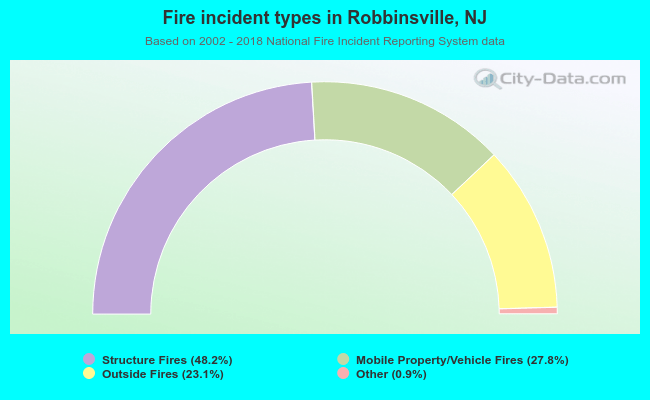 When looking into fire subcategories, the most incidents belonged to: Structure Fires (48.2%), and Mobile Property/Vehicle Fires (27.8%).