| Fire incidents reported |
|---|
| Sreet name | Count |
|---|
| PENN AVE | 78 | | HILL RD | 44 | | WERNERSVILLE STATE HOS. | 32 | | CHURCH ST | 28 | | BIG SPRING RD | 20 | | TEXTER MOUNTAIN RD | 20 | | FREEMAN ST | 18 | | OLD WEST PENN AVE | 18 | | BERNVILLE/ROBESONIA RD | 16 | | MEADOW AVE | 14 | | BIG SPRING (48) RD | 12 | | CHARMING FORGE RD | 12 | | PENN (47) AVE | 12 | | QUARRY RD | 12 | | BROWNSVILLE RD | 10 | | CHURCH (47) ST | 10 | | TULPEHOCKEN FORGE RD | 10 | | DIPLOMAT DR | 8 | | ELM ST | 8 | | OLD CHURCH RD | 8 | | PENN47 AVE | 8 | | BUNKER HILL RD | 6 | | CHARMING FORGE RD | 6 | | CHURCH ST | 6 | | CONRAD WEISER HIGH SCHOOL | 6 |
| | | Fire incidents reported |
|---|
| Sreet name | Count |
|---|
| HILDA ST | 6 | | LAMMS MILL RD | 6 | | MANBECK RD | 6 | | MEADOW (47) AVE | 6 | | OLD PENN AVE | 6 | | PENN ST | 6 | | ROBESON ST | 6 | | SCHOOL LA | 6 | | TEXTER MISSION RD | 6 | | 422 & BIG SPRING RDS | 4 | | 422 & LINDEN ST. | 4 | | AWI | 4 | | BERNVILLE48 RD | 4 | | BIG SPRING48 RD | 4 | | BROWNSVILLE (52) RD | 4 | | CHARMING FORGE (48) RD | 4 | | CW MIDDLE SCHOOL | 4 | | EGE CT | 4 | | FREEMAN ST | 4 | | FURNACE ST | 4 | | GINNA B48 DR | 4 | | GRAEFF RD | 4 | | HEIDELBERG RD | 4 | | HEIDELBERG RD | 4 | | |
|
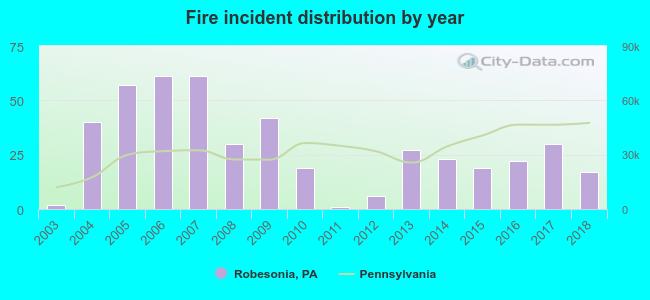 Based on the data from the years 2003 - 2018 the average number of fires per year is 29. The highest number of fires - 61 took place in 2006, and the least - 1 in 2011. The data has a growing trend.
 30.4% incidents where reported in the morning and 69.6% in the evening. The most fires (16.6%) took place on Friday, and the least (11.8%) on Monday.
 According to the 457 fires from years 2003 - 2018 most fires (12.0%) took place during June, and the least (6.1%) in December.
 Out of all 1,141 cases reported during the years 2003 - 2018, the most belonged to the categories: Fire (40.1%), Rescue & EMS (19.0%), and Hazardous Condition (11.0%).
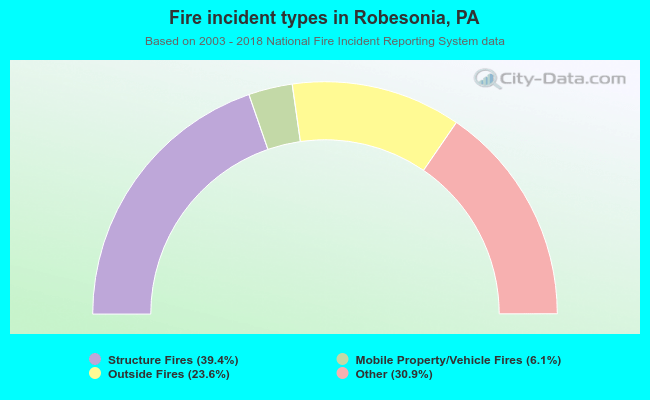 When looking into fire subcategories, the most incidents belonged to: Structure Fires (39.4%), and Other (30.9%).