| Fire incidents reported |
|---|
| Sreet name | Count |
|---|
| ROCK CITY RD | 44 | | EGGERT RD | 36 | | SIEDSCHLAG RD | 22 | | ROCK GROVE RD | 12 | | CEDARVILLE RD | 10 | | DAKOTA RD | 10 | | FARM SCHOOL RD | 8 | | MARKET ST | 8 | | WINNESHIEK RD | 8 | | CENTER ST | 6 | | FAWVER RD | 6 | | PLEASANT VIEW RD | 6 | | ROCK CITY ROAD | 6 | | 9469 N FAWVER RD | 4 | | BROWN RD | 4 | | CHAPEL RD | 4 | | CLAY ST | 4 | | DEAD END RD | 4 | | ILLINOIS ROUTE 75 | 4 | | MCCONNELL RD | 4 | | N ROCK CITY RD | 4 | | 10010 NORTH ROCK CITY RD | 2 | | 12848 N SIEDSCHLAG RD | 2 | | 301 EAST CENTER ST | 2 | | 361 CENTER ST | 2 |
| | | Fire incidents reported |
|---|
| Sreet name | Count |
|---|
| 4416 ROCK GROVE RD | 2 | | 6144 E. WINNESHIEK RD. | 2 | | 7552 E SCHOKEY RD | 2 | | 7552 E SHOCKEY RD | 2 | | BRICK SCHOOL RD | 2 | | CHURCH RD | 2 | | DOUGLAS ST | 2 | | EGGERT ROAD | 2 | | FARWELL BRIDGE RD | 2 | | IGOR SIKORSKY ST | 2 | | IL RT 75 HWY | 2 | | IL RT 75 RT | 2 | | JUDA RD | 2 | | KNOUP RD | 2 | | MAIN ST | 2 | | MAIN STRE | 2 | | MAIZE RD | 2 | | MCCONNEL RD | 2 | | MCCONNELL ROAD | 2 | | RIVER RD | 2 | | ROCK CITY RD & PLEASANT VIEW | 2 | | SHOCKEY RD | 2 | | STATE LINE RD | 2 | | STATELINE RD | 2 | | TOELKE RD | 2 |
|
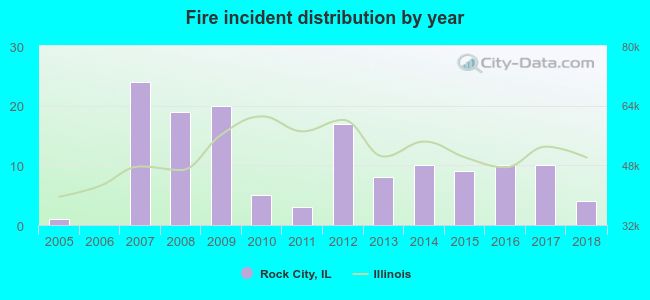 According to the data from the years 2005 - 2018 the average number of fire incidents per year is 10. The highest number of fires - 24 took place in 2007, and the least - 0 in 2006. The data has an increasing trend.
 32.1% incidents where reported in the morning and 67.9% in the evening. The most fires (25.0%) took place on Thursday, and the least (10.0%) on Wednesday.
 Based on the 140 fire incident reports from years 2005 - 2018 most fires (20.7%) took place during April, and the least (0.7%) in August.
 Out of all 223 cases reported during the years 2005 - 2018, the most belonged to the categories: Fire (62.8%), Rescue & EMS (14.8%), and Overpressure Rupture (14.3%).
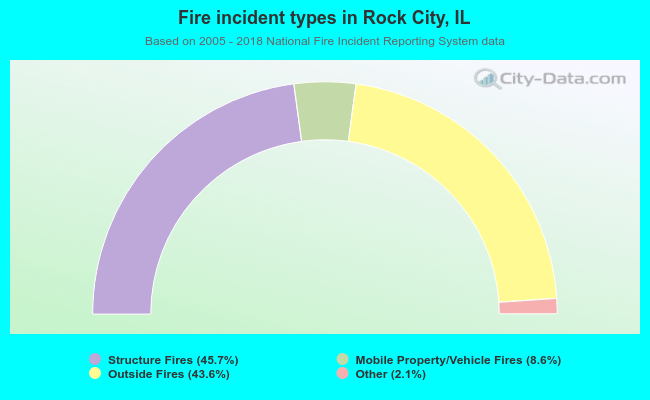 When looking into fire subcategories, the most incidents belonged to: Structure Fires (45.7%), and Outside Fires (43.6%).