Rock Hill: Fire Incidents, South Carolina (SC)
Where are fire incidents reported in Rock Hill, SC
Something went wrong! Please refresh the page.
| Fire incidents reported | |
|---|---|
| Sreet name | Count |
| CHERRY RD | 324 |
| MAIN ST | 256 |
| ANDERSON RD | 214 |
| DAVE LYLE BLVD | 146 |
| HECKLE BLVD | 136 |
| EDEN TER | 118 |
| CELANESE RD | 96 |
| MT GALLANT RD | 88 |
| SPRINGDALE RD | 88 |
| EBENEZER RD | 80 |
| SALUDA RD | 78 |
| INDIA HOOK RD | 72 |
| SALUDA ST | 72 |
| WHITE ST | 70 |
| I77 | 68 |
| RIVERVIEW RD | 68 |
| I-77 | 66 |
| GREEN ST | 62 |
| OLD YORK RD | 60 |
| BLACK ST | 58 |
| ALBRIGHT RD | 54 |
| PATRIOT | 52 |
| PATRIOT PKWY | 52 |
| I77 HWY | 50 |
| CRAWFORD RD | 48 |
| RAUCH ST | 48 |
| HERLONG AV | 46 |
| ANNAFREL ST | 42 |
| CONFEDERATE AVE | 42 |
| CONSTITUTION BLVD | 42 |
| Other | 2,054 |
2003 - 2018 National Fire Incident Reporting System (NFIRS) incidents
- Incident types reported to NFIRS in Rock Hill, SC
- 19,80646.3%Rescue & EMS
- 7,65017.9%Good Intent Call
- 4,75011.1%Fire
- 4,31310.1%Hazardous Condition
- 3,3587.8%Service Call
- 2,8076.6%False Alarm
- 480.1%Severe Weather
- Fire incident types reported to NFIRS in Rock Hill, SC
- 1,95841.2%Structure Fires
- 1,62334.2%Outside Fires
- 91519.3%Mobile Property/Vehicle Fires
- 2545.3%Other
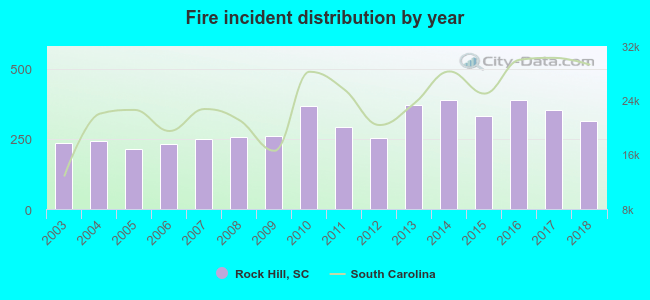 According to the data from the years 2003 - 2018 the average number of fires per year is 297. The highest number of fires - 388 took place in 2014, and the least - 213 in 2005. The data has a rising trend.
The average number of yearly fire incidents per 10k residents in Rock Hill, SC compared to nearest cities:
(Note: Based on data for the last 3 years, including only cities with population 5,000 and above)
| Rock Hill: | 50.2 |
| Fort Mill: | 111.3 |
| Tega Cay: | 23.8 |
| Lake Wylie: | 3.4 |
| York: | 138.1 |
| Clover: | 131.4 |
| Chester: | 166.2 |
| Lancaster: | 574.4 |
| Gaffney: | 158.0 |
 The median response time based on all reported fire incidents is 6 minutes. This is similar to the state median value.
The median response time in Rock Hill, SC compared to nearest cities:
(Note: Based on data for all years, including only cities with at least 500 fire incidents)
| Rock Hill: | 6 minutes |
| Fort Mill: | 8 minutes |
| York: | 8 minutes |
| Pineville: | 7 minutes |
| Richburg: | 7 minutes |
| Waxhaw: | 8 minutes |
| Clover: | 8 minutes |
| Chester: | 5 minutes |
| Lancaster: | 9 minutes |
 According to the reports from the years 2003 - 2018 the average number of fire-related yearly deaths is 0. The highest number of reported deaths - 1 took place in 2004, and the lowest - 0 in 2003. The data has a constant trend.
The average number of deaths per 1,000 fires is 1. This indicator was the highest - 4 in 2006, and the lowest 0 in 2003. The trend for deaths per 1,000 incidents is decreasing. Compared to the state value the number of deaths per 1,000 incidents is lower.
According to the reports from the years 2003 - 2018 the average number of fire-related yearly deaths is 0. The highest number of reported deaths - 1 took place in 2004, and the lowest - 0 in 2003. The data has a constant trend.
The average number of deaths per 1,000 fires is 1. This indicator was the highest - 4 in 2006, and the lowest 0 in 2003. The trend for deaths per 1,000 incidents is decreasing. Compared to the state value the number of deaths per 1,000 incidents is lower.
 According to the data from the years 2003 - 2018 the average number of fire-related casualties per year is 2. The highest number of reported casualties - 4 took place in 2006, and the lowest - 0 in 2018. The data has a dropping trend.
The average number of casualties per 1,000 fire incidents is 7. This indicator was the highest - 17 in 2006, and the lowest 0 in 2018. The trend for injuries per 1,000 fires is decreasing. Compared to the state value the number of injuries per 1,000 incidents is similar.
According to the data from the years 2003 - 2018 the average number of fire-related casualties per year is 2. The highest number of reported casualties - 4 took place in 2006, and the lowest - 0 in 2018. The data has a dropping trend.
The average number of casualties per 1,000 fire incidents is 7. This indicator was the highest - 17 in 2006, and the lowest 0 in 2018. The trend for injuries per 1,000 fires is decreasing. Compared to the state value the number of injuries per 1,000 incidents is similar.
 29.3% incidents where reported in the morning and 70.7% in the evening. The most fires (15.3%) took place on Saturday, and the least (12.8%) on Wednesday.
 According to the 4,750 reports from years 2003 - 2018 most fires (10.6%) took place during March, and the least (6.8%) in October.
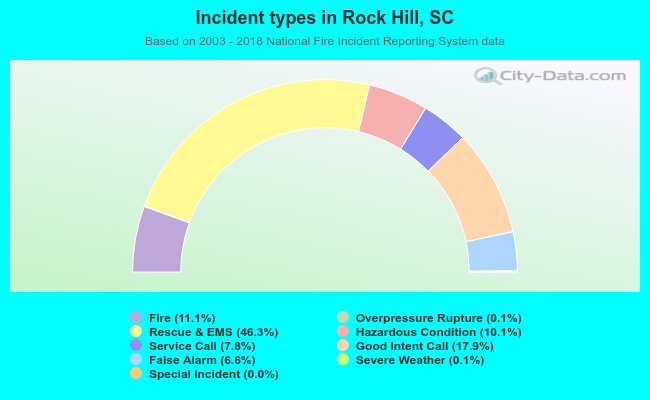 Out of all 42,779 cases reported during the years 2003 - 2018, the most belonged to the categories: Rescue & EMS (46.3%), Good Intent Call (17.9%), and Fire (11.1%).
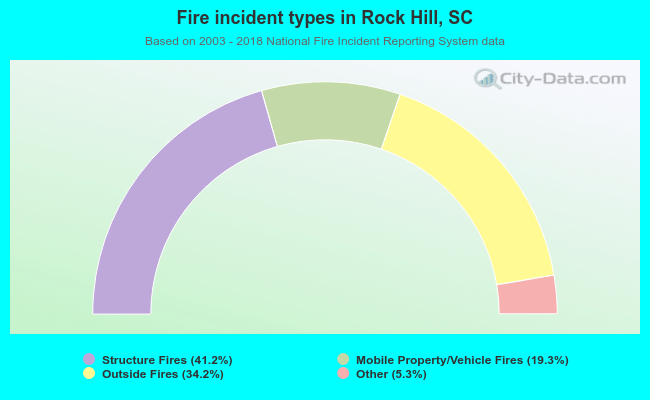 When looking into fire subcategories, the most incidents belonged to: Structure Fires (41.2%), and Outside Fires (34.2%).