Rolling Fork: Fire Incidents, Mississippi (MS)
Where are fire incidents reported in Rolling Fork, MS
Something went wrong! Please refresh the page.
|
| |||||||||||||||||||||||||||||||||||||||||||||||||||||||||||||||||||||||||||||||||||||||||||||||||||||||||||||
2003 - 2018 National Fire Incident Reporting System (NFIRS) incidents
- Incident types reported to NFIRS in Rolling Fork, MS
- 34789.0%Fire
- 184.6%Hazardous Condition
- 112.8%Good Intent Call
- 71.8%Rescue & EMS
- 51.3%Service Call
- 20.5%False Alarm
- Fire incident types reported to NFIRS in Rolling Fork, MS
- 20057.6%Structure Fires
- 7621.9%Outside Fires
- 6719.3%Mobile Property/Vehicle Fires
- 41.2%Other
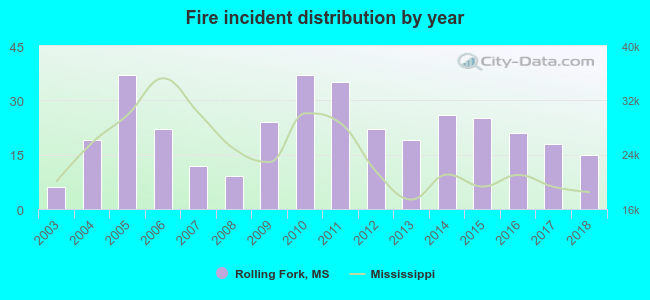 Based on the data from the years 2003 - 2018 the average number of fire incidents per year is 22. The highest number of reported fire incidents - 37 took place in 2005, and the least - 6 in 2003. The data has an increasing trend.
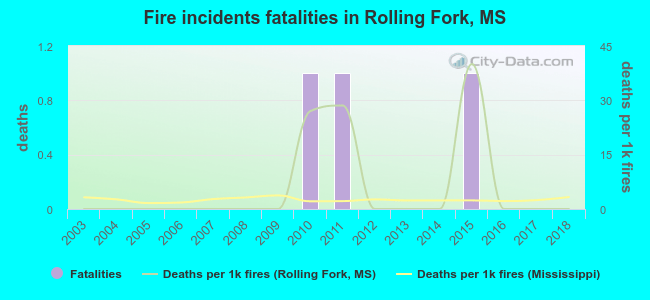 According to the data from the years 2003 - 2018 the average number of fire-related fatalities per year is 0. The highest number of reported deaths - 1 took place in 2010, and the lowest - 0 in 2003. The data has a constant trend.
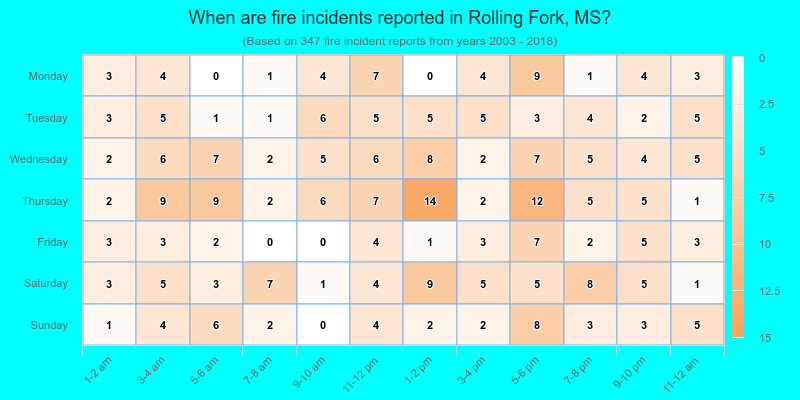
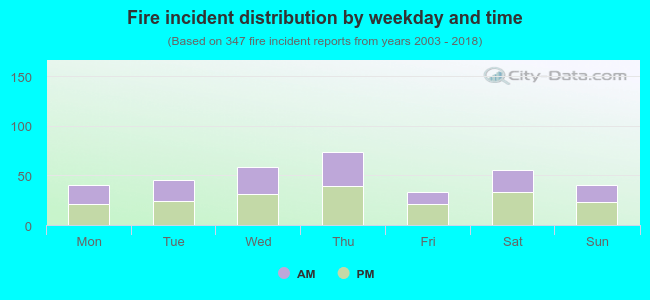 44.7% incidents where reported in the morning and 55.3% in the evening. The most fires (21.3%) took place on Thursday, and the least (9.5%) on Friday.
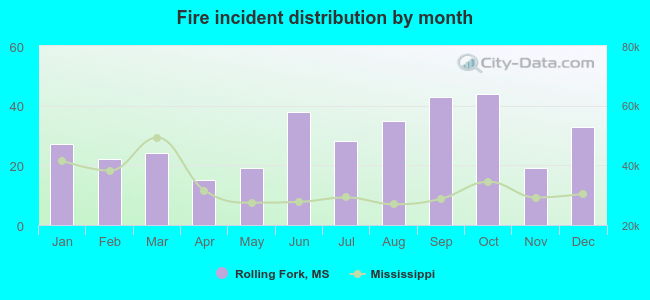 According to the 347 fire incidents from years 2003 - 2018 most fires (12.7%) took place during October, and the least (4.3%) in April.
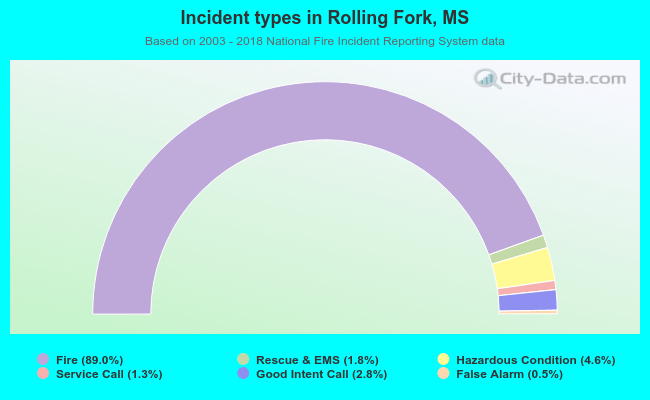 Out of all 390 cases reported during the years 2003 - 2018, the most belonged to the categories: Fire (89.0%), Rescue & EMS (4.6%), and Service Call (2.8%).
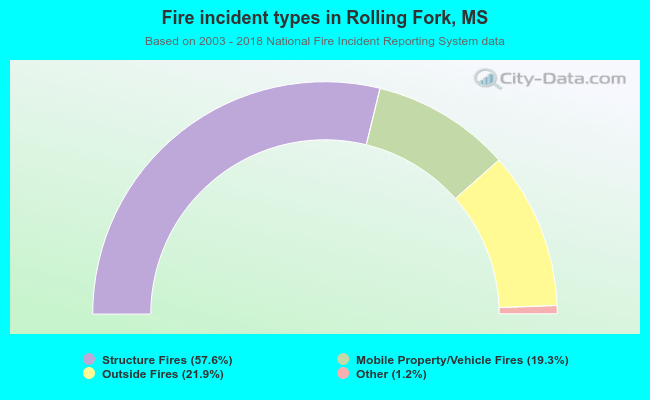 When looking into fire subcategories, the most incidents belonged to: Structure Fires (57.6%), and Outside Fires (21.9%).