Romulus: Fire Incidents, New York (NY)
Where are fire incidents reported in Romulus, NY
Something went wrong! Please refresh the page.
|
| |||||||||||||||||||||||||||||||||||||||||||||||||||||||||||||||||||||||||||||||||||||||||||||||||||||||||||||
2002 - 2018 National Fire Incident Reporting System (NFIRS) incidents
- Incident types reported to NFIRS in Romulus, NY
- 54737.4%Rescue & EMS
- 36625.0%False Alarm
- 16010.9%Fire
- 1318.9%Good Intent Call
- 1258.5%Service Call
- 1097.4%Hazardous Condition
- 141.0%Special Incident
- 100.7%Severe Weather
- 20.1%Overpressure Rupture
- Fire incident types reported to NFIRS in Romulus, NY
- 10867.5%Structure Fires
- 3119.4%Outside Fires
- 159.4%Other
- 63.8%Mobile Property/Vehicle Fires
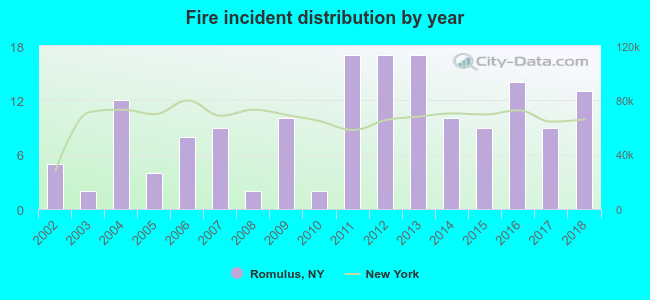 Based on the data from the years 2002 - 2018 the average number of fires per year is 9. The highest number of reported fires - 17 took place in 2011, and the least - 2 in 2003. The data has an increasing trend.
 29.4% incidents where reported in the morning and 70.6% in the evening. The most fires (26.9%) took place on Saturday, and the least (8.8%) on Wednesday.
 Based on the 160 reports from years 2002 - 2018 most fires (11.9%) took place during November, and the least (5.0%) in July.
 Out of all 1,464 cases reported during the years 2002 - 2018, the most belonged to the categories: Rescue & EMS (37.4%), False Alarm (25.0%), and Fire (10.9%).
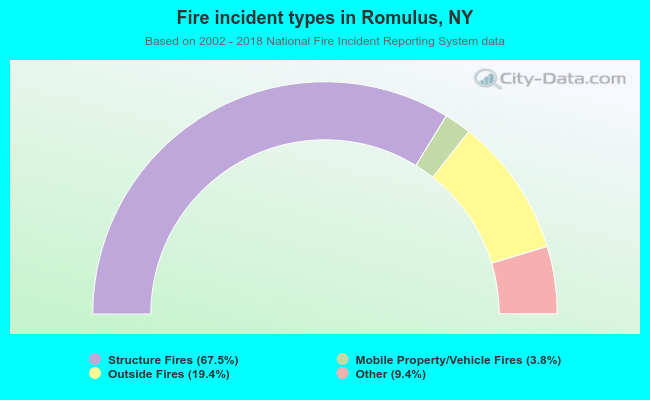 When looking into fire subcategories, the most reports belonged to: Structure Fires (67.5%), and Outside Fires (19.4%).