| Fire incidents reported |
|---|
| Sreet name | Count |
|---|
| WILDERNESS RD | 14 | | MARTINS CREEK RD | 8 | | DR THOMAS WALKER RD | 6 | | GLENN DANIEL LN | 6 | | HWY 58 | 6 | | SPEAKS BRANCH RD | 6 | | VALLEY SPRINGS RD | 6 | | VALLEY SPRINGS RD | 6 | | BLUE HOLLOW RD | 4 | | BURNING WELL RD | 4 | | CAMBELL DR DR | 4 | | CROCKETT RIDGE RD | 4 | | DR THOMAS WALKER | 4 | | FLATWOODS RD | 4 | | GOLF COURSE RD | 4 | | JIM MOORE RDG | 4 | | LEFT POOR VALLEY | 4 | | MCLIN HOLLOW RD | 4 | | OLD NURSERY RD | 4 | | ROSE HILL DR | 4 | | RT 667 | 4 | | SPRUCE DRIV | 4 | | STICKLEY HOLLOW RD | 4 | | WINTERBERRY RD | 4 | | 1163 MARTINS CREEK RD | 2 |
| | | Fire incidents reported |
|---|
| Sreet name | Count |
|---|
| 167 OLD NURSERY RD RD | 2 | | 242 GATE WAY DR. | 2 | | 245 TUCKER LOWE RD | 2 | | 269 ROSE HILL DR | 2 | | 272 MISSIONTRAIL RD | 2 | | 277 ROLLING HILLS DR | 2 | | 2970 MARTIN CREEK RD | 2 | | 608 GILES HOLLOW RD | 2 | | 671 & 676 | 2 | | BALLS CHAPEL CHURCH RD | 2 | | BASHIE KINCADE RD | 2 | | CAMPIE TRAILER PARK RD | 2 | | CHADWELL STATION RD | 2 | | DEERFIELD LN | 2 | | DR THOMAS WALKER ROAD | 2 | | DR THOMAS WALKER RD | 2 | | GATEWAY | 2 | | GATEWAY DR | 2 | | GATEWAY DRIV | 2 | | GILES HOLLOW | 2 | | GILES HOLLOW RD | 2 | | GLENN DANIEL DR | 2 | | GLENN DANIEL DR. | 2 | | GOLF RD | 2 | | |
|
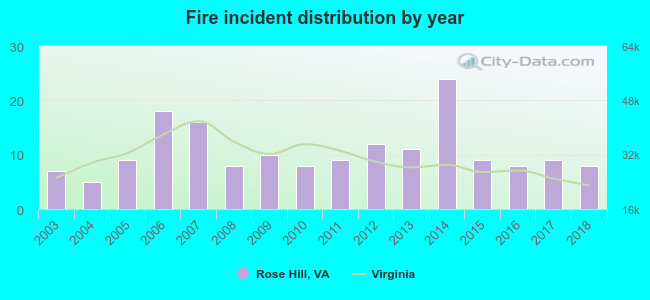 According to the data from the years 2003 - 2018 the average number of fire incidents per year is 11. The highest number of fire incidents - 24 took place in 2014, and the least - 5 in 2004. The data has an increasing trend.
 30.4% incidents where reported in the morning and 69.6% in the evening. The most fires (19.3%) took place on Friday, and the least (9.9%) on Tuesday.
 Based on the 171 reports from years 2003 - 2018 most fires (19.9%) took place during March, and the least (4.7%) in June.
 Out of all 273 cases reported during the years 2003 - 2018, the most belonged to the categories: Fire (62.6%), Overpressure Rupture (20.1%), and Rescue & EMS (7.3%).
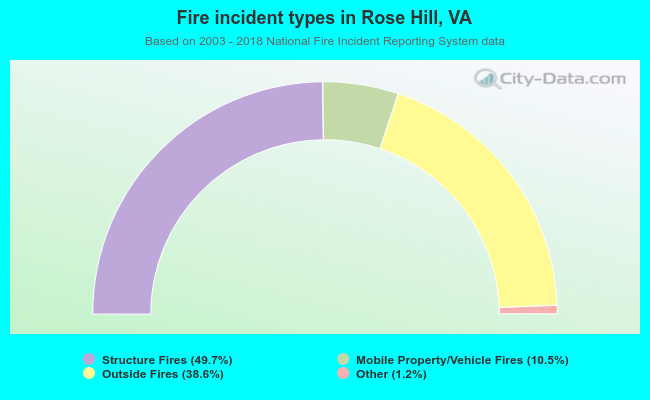 When looking into fire subcategories, the most reports belonged to: Structure Fires (49.7%), and Outside Fires (38.6%).