Rush City: Fire Incidents, Minnesota (MN)
Where are fire incidents reported in Rush City, MN
Something went wrong! Please refresh the page.
|
| |||||||||||||||||||||||||||||||||||||||||||||||||||||||||||||||||||||||||||||||||||||||||||||||||||||||||||||
2002 - 2018 National Fire Incident Reporting System (NFIRS) incidents
- Incident types reported to NFIRS in Rush City, MN
- 36851.3%Fire
- 11616.2%Hazardous Condition
- 9813.6%Good Intent Call
- 689.5%Rescue & EMS
- 385.3%False Alarm
- 121.7%Service Call
- 111.5%Overpressure Rupture
- 40.6%Severe Weather
- 30.4%Special Incident
- Fire incident types reported to NFIRS in Rush City, MN
- 14238.6%Structure Fires
- 13637.0%Outside Fires
- 6517.7%Mobile Property/Vehicle Fires
- 256.8%Other
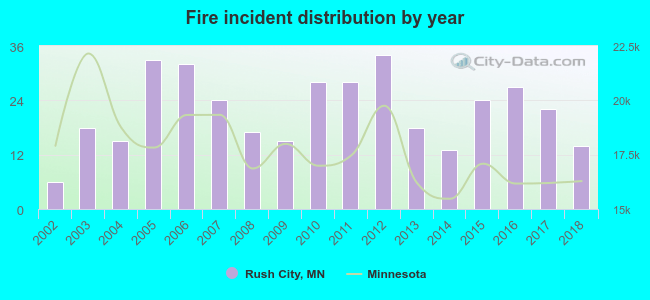 According to the data from the years 2002 - 2018 the average number of fires per year is 22. The highest number of fires - 34 took place in 2012, and the least - 6 in 2002. The data has a rising trend.
 31.0% incidents where reported in the morning and 69.0% in the evening. The most fires (19.8%) took place on Saturday, and the least (10.9%) on Wednesday.
 According to the 368 reports from years 2002 - 2018 most fires (13.3%) took place during April, and the least (4.3%) in August.
 Out of all 718 cases reported during the years 2002 - 2018, the most belonged to the categories: Fire (51.3%), Hazardous Condition (16.2%), and Good Intent Call (13.6%).
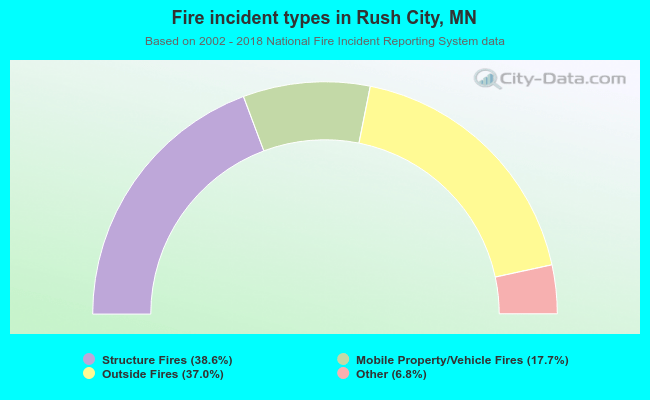 When looking into fire subcategories, the most reports belonged to: Structure Fires (38.6%), and Outside Fires (37.0%).