Rushville: Fire Incidents, Illinois (IL)
Where are fire incidents reported in Rushville, IL
Something went wrong! Please refresh the page.
|
| |||||||||||||||||||||||||||||||||||||||||||||||||||||||||||||||||||||||||||||||||||||||||||||||||||||||||||||
| Other | 80 | |||||||||||||||||||||||||||||||||||||||||||||||||||||||||||||||||||||||||||||||||||||||||||||||||||||||||||||
2006 - 2018 National Fire Incident Reporting System (NFIRS) incidents
- Incident types reported to NFIRS in Rushville, IL
- 31648.8%Fire
- 18929.2%Hazardous Condition
- 7010.8%Rescue & EMS
- 487.4%Good Intent Call
- 132.0%Service Call
- 81.2%False Alarm
- 30.5%Overpressure Rupture
- 10.2%Special Incident
- Fire incident types reported to NFIRS in Rushville, IL
- 13041.1%Outside Fires
- 11937.7%Structure Fires
- 6319.9%Mobile Property/Vehicle Fires
- 41.3%Other
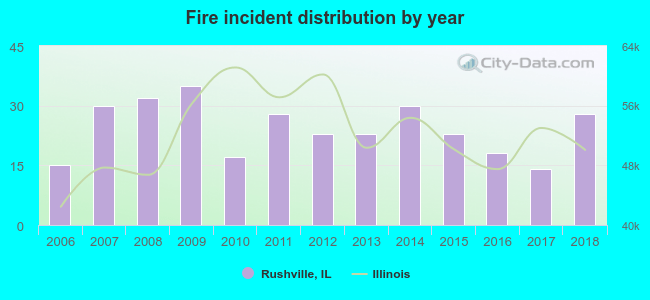 Based on the data from the years 2006 - 2018 the average number of fires per year is 24. The highest number of fires - 35 took place in 2009, and the least - 14 in 2017. The data has a growing trend.
 28.8% incidents where reported in the morning and 71.2% in the evening. The most fires (17.7%) took place on Saturday, and the least (12.0%) on Monday.
 Based on the 316 fire incident reports from years 2006 - 2018 most fires (16.5%) took place during March, and the least (6.0%) in February.
 Out of all 648 cases reported during the years 2006 - 2018, the most belonged to the categories: Fire (48.8%), Hazardous Condition (29.2%), and Rescue & EMS (10.8%).
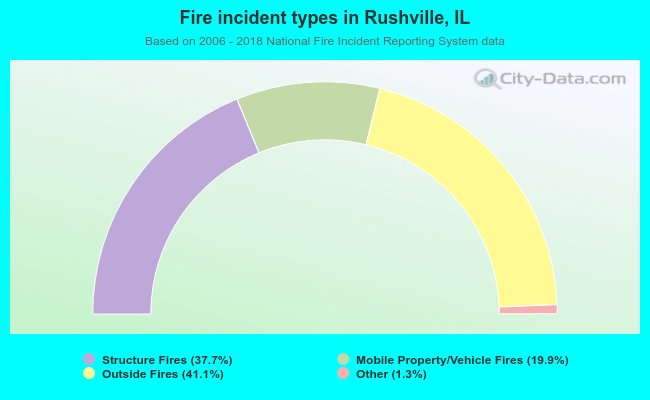 When looking into fire subcategories, the most reports belonged to: Outside Fires (41.1%), and Structure Fires (37.7%).