| Fire incidents reported |
|---|
| Sreet name | Count |
|---|
| ADAMS RD | 26 | | MOORES FERRY RD | 26 | | US 60 HWY | 26 | | US 60 | 12 | | VANLANDINGHAM RD | 12 | | FRALEY RD | 10 | | HWY 211 | 10 | | OLD SANDS RD | 10 | | KY 211 HWY | 8 | | MCCARTY BRANCH ROAD | 8 | | 2354 ADAMS ROAD | 6 | | 27 KNOB LICK ROAD | 6 | | 57 WADE DRIVE | 6 | | 609 MAIN STREET | 6 | | CHURCH ST | 6 | | MCCARTY BRANCH RD | 6 | | MOORES FERRY RD | 6 | | OLD MIDLAND TRL | 6 | | S HWY 211 | 6 | | 1766 ADAMS ROAD | 4 | | 211 HWY | 4 | | 345 BYPASS ROAD | 4 | | 44 FERGUSON ROAD | 4 | | BUSH LN | 4 | | FERGUSON RD | 4 |
| | | Fire incidents reported |
|---|
| Sreet name | Count |
|---|
| HARDIN RD | 4 | | LITTLE SANDY RD | 4 | | MCCULLOUGH HOLLOW RD | 4 | | MCKENZIE RD | 4 | | RAILROAD ST | 4 | | SPRING HOLLOW RD | 4 | | TREES RD | 4 | | WOODS LN | 4 | | 47 CENTER FIRE LANE | 2 | | 100 BLOCK ADAMS ROAD | 2 | | 100 RIDDLE ROAD | 2 | | 101 SPRING HOLLOW ROAD | 2 | | 10600 BLOCK US 60 EAST | 2 | | 108 DICKERSON CEMETARY ROAD | 2 | | 1109 VANLANDINGHAM ROAD | 2 | | 1210 ADAMS ROAD | 2 | | 129 SPRUCE LANE | 2 | | 155 MCKENZIE ROAD | 2 | | 159 MAZE LANE | 2 | | 1600 BLK VANLANDINGHAM RD | 2 | | 1660 ADAMS ROAD | 2 | | 1734 ADAMS ROAD | 2 | | 18 MOORES FERRY ROAD | 2 | | 184 SLATE LICK ROAD | 2 | | 1926 ADAMS ROAD | 2 |
|
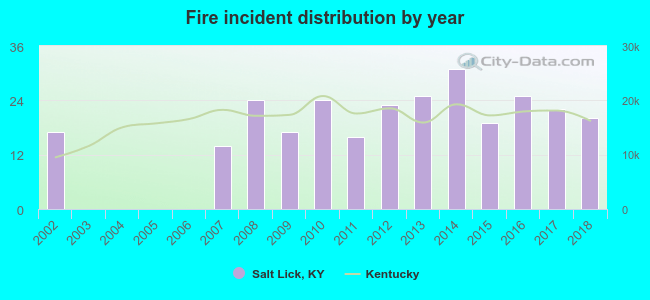 Based on the data from the years 2002 - 2018 the average number of fires per year is 16. The highest number of reported fire incidents - 31 took place in 2014, and the least - 0 in 2003. The data has an increasing trend.
 30.7% incidents where reported in the morning and 69.3% in the evening. The most fires (19.1%) took place on Wednesday, and the least (11.6%) on Sunday.
 Based on the 277 fire incidents from years 2002 - 2018 most fires (13.7%) took place during November, and the least (3.6%) in May.
 Out of all 1,178 cases reported during the years 2002 - 2018, the most belonged to the categories: Rescue & EMS (57.6%), Fire (23.5%), and Good Intent Call (8.4%).
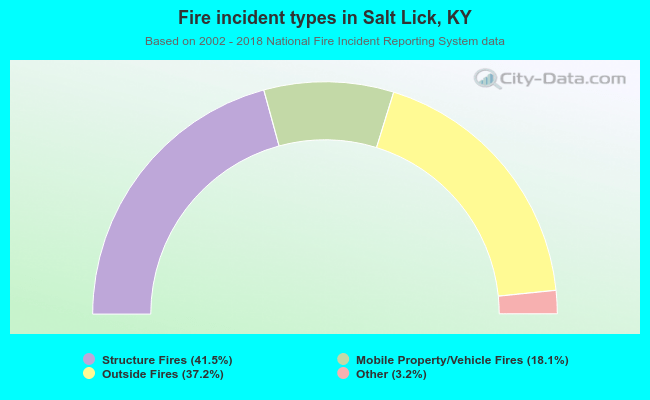 When looking into fire subcategories, the most incidents belonged to: Structure Fires (41.5%), and Outside Fires (37.2%).