San Jose: Fire Incidents, Illinois (IL)
Where are fire incidents reported in San Jose, IL
Something went wrong! Please refresh the page.
|
| |||||||||||||||||||||||||||||||||||||||||||||||||||||||||||||||||||||||||||||||||||||||||||||||||||||||||||||
2002 - 2018 National Fire Incident Reporting System (NFIRS) incidents
- Incident types reported to NFIRS in San Jose, IL
- 15466.4%Fire
- 2510.8%Good Intent Call
- 229.5%Service Call
- 198.2%Hazardous Condition
- 83.4%False Alarm
- 41.7%Rescue & EMS
- Fire incident types reported to NFIRS in San Jose, IL
- 6441.6%Outside Fires
- 6340.9%Structure Fires
- 2314.9%Mobile Property/Vehicle Fires
- 42.6%Other
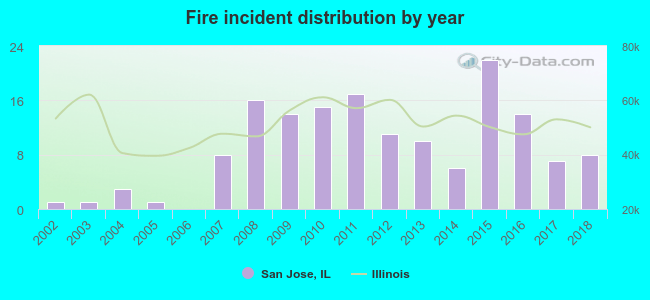 According to the data from the years 2002 - 2018 the average number of fire incidents per year is 9. The highest number of fires - 22 took place in 2015, and the least - 0 in 2006. The data has a growing trend.
 31.8% incidents where reported in the morning and 68.2% in the evening. The most fires (20.8%) took place on Friday, and the least (8.4%) on Saturday.
 According to the 154 incident reports from years 2002 - 2018 most fires (21.4%) took place during October, and the least (1.3%) in December.
 Out of all 232 cases reported during the years 2002 - 2018, the most belonged to the categories: Fire (66.4%), Service Call (10.8%), and Hazardous Condition (9.5%).
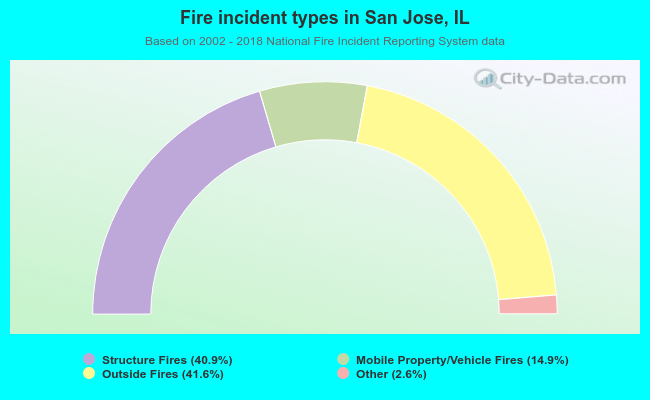 When looking into fire subcategories, the most reports belonged to: Outside Fires (41.6%), and Structure Fires (40.9%).