San Juan: Fire Incidents, Texas (TX)
Where are fire incidents reported in San Juan, TX
Something went wrong! Please refresh the page.
| Fire incidents reported | |
|---|---|
| Sreet name | Count |
| STEWART RD | 102 |
| I RD | 86 |
| RAUL LONGORIA HWY | 82 |
| 495 | 60 |
| CESAR CHAVEZ RD | 58 |
| RAUL LONGORIA | 58 |
| ELDORA RD | 54 |
| 83 EXPY | 48 |
| FRONTAGE RD | 48 |
| STEWART | 42 |
| NOLANA LOOP | 36 |
| SIOUX RD | 32 |
| NEBRASKA AVE | 30 |
| MINNESOTA RD | 26 |
| CESAR CHAVEZ | 24 |
| ELDORA | 24 |
| NOLANA | 24 |
| EL DORA | 22 |
| SAN ANTONIO AVE | 22 |
| STANDARD AVE | 22 |
| HALL ACRES RD | 20 |
| IOWA | 20 |
| NEBRASKA | 20 |
| RIDGE RD | 20 |
| 83 BUS | 18 |
| FRONTAGE | 18 |
| JUAN BALLI RD | 18 |
| OWASSA RD | 18 |
| 11TH ST | 16 |
| 3RD | 16 |
| Other | 626 |
2002 - 2018 National Fire Incident Reporting System (NFIRS) incidents
- Incident types reported to NFIRS in San Juan, TX
- 2,81044.2%Rescue & EMS
- 1,71026.9%Fire
- 83813.2%Hazardous Condition
- 4597.2%False Alarm
- 3215.1%Good Intent Call
- 1893.0%Service Call
- 160.3%Special Incident
- 70.1%Overpressure Rupture
- Fire incident types reported to NFIRS in San Juan, TX
- 99658.2%Outside Fires
- 30818.0%Structure Fires
- 30217.7%Mobile Property/Vehicle Fires
- 1046.1%Other
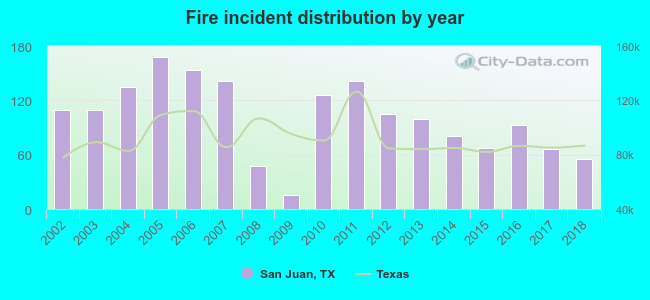 According to the data from the years 2002 - 2018 the average number of fire incidents per year is 101. The highest number of reported fires - 168 took place in 2005, and the least - 15 in 2009. The data has a dropping trend.
The average number of yearly fire incidents per 10k residents in San Juan, TX compared to nearest cities:
(Note: Based on data for the last 3 years, including only cities with population 5,000 and above)
| San Juan: | 19.7 |
| Alamo: | 70.4 |
| Pharr: | 4.1 |
| McAllen: | 22.8 |
| Donna: | 2.0 |
| Edinburg: | 37.3 |
| Hidalgo: | 2.0 |
| Weslaco: | 24.2 |
| Mission: | 27.3 |
 The median response time based on all reported fire incidents is 5 minutes. This is lower than the Texas median value.
The median response time in San Juan, TX compared to nearest cities:
(Note: Based on data for all years, including only cities with at least 500 fire incidents)
| San Juan: | 5 minutes |
| Alamo: | 5 minutes |
| Pharr: | 4 minutes |
| McAllen: | 5 minutes |
| Edinburg: | 7 minutes |
| Weslaco: | 7 minutes |
| Mission: | 6 minutes |
| Elsa: | 5 minutes |
| Palmview: | 6 minutes |
 30.2% incidents where reported in the morning and 69.8% in the evening. The most fires (16.4%) took place on Saturday, and the least (12.9%) on Thursday.
 According to the 1,710 reports from years 2002 - 2018 most fires (9.5%) took place during December, and the least (7.0%) in September.
 Out of all 6,354 cases reported during the years 2002 - 2018, the most belonged to the categories: Rescue & EMS (44.2%), Fire (26.9%), and Hazardous Condition (13.2%).
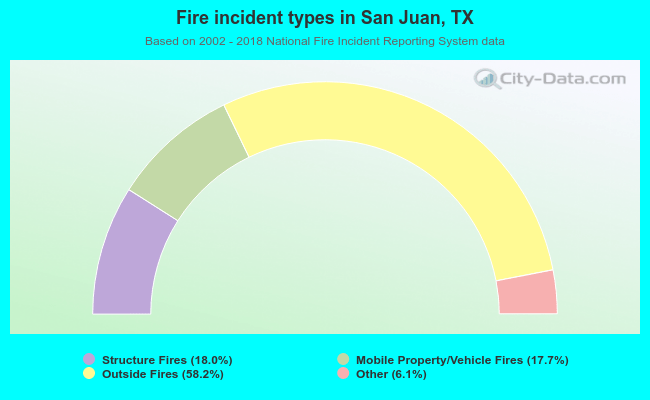 When looking into fire subcategories, the most incidents belonged to: Outside Fires (58.2%), and Structure Fires (18.0%).