| Fire incidents reported |
|---|
| Sreet name | Count |
|---|
| ANDERSON ST | 16 | | HWY 59 HWY | 14 | | GRANDVIEW RD | 12 | | 59 HWY | 10 | | COLLEGE ST | 8 | | 407 ANTNEY ST | 6 | | 67 HWY | 6 | | CO. RD. 1450 RD | 6 | | COUNTY ROAD 1375 | 6 | | COUNTY ROAD 1450 | 6 | | 126 ANDERSON ST | 4 | | 301 ANDERSON ST | 4 | | 311 CORBIN ST | 4 | | 416 OAK ST | 4 | | 5494 HWY 59 HWY | 4 | | CO. RD. 1375 RD | 4 | | CO. RD. 450 RD | 4 | | CO. RD. 800 RD | 4 | | CORBIN ST | 4 | | HUEY RD | 4 | | HWY 58 HWY | 4 | | HWY 67 HWY | 4 | | JERRICO RD | 4 | | MARKET ST | 4 | | ST. RD. 58 HWY | 4 |
| | | Fire incidents reported |
|---|
| Sreet name | Count |
|---|
| 105 WAGGONER ST | 2 | | 107 ANDERSON ST | 2 | | 110 MAIN ST | 2 | | 111 MAPLE ST | 2 | | 11257 TEXAS GAS RD | 2 | | 1150 RD | 2 | | 117 RUSSELL ST | 2 | | 119 ANDERSON ST | 2 | | 12855 CO9RD 750 S RD | 2 | | 13140 BOWMAN RD | 2 | | 14441 N. HUEY RD | 2 | | 14723 CO RD 450 S RD | 2 | | 1500 RD | 2 | | 15209 HWY 67 HWY | 2 | | 15300 ST. HWY 59 & 67 HWY | 2 | | 15503 HUDSON RD | 2 | | 16912 HWY 58 HWY | 2 | | 18232 GRANVIEW RD | 2 | | 204 ELEVATOR ST | 2 | | 206 WAGGONER ST | 2 | | 211 ANDERSON ST | 2 | | 238 HWY 67 HWY | 2 | | 414 COLLEGE ST | 2 | | 715 RD | 2 | | |
|
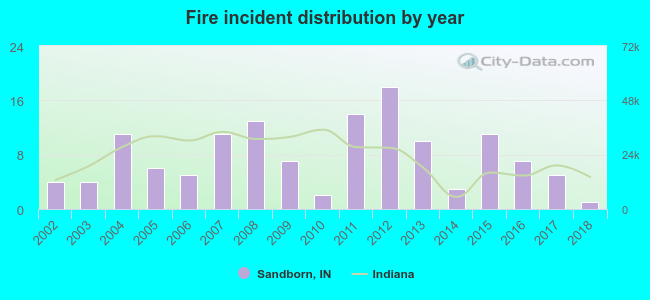 Based on the data from the years 2002 - 2018 the average number of fires per year is 8. The highest number of reported fire incidents - 18 took place in 2012, and the least - 1 in 2018. The data has a declining trend.
 22.7% incidents where reported in the morning and 77.3% in the evening. The most fires (18.2%) took place on Friday, and the least (10.6%) on Thursday.
 According to the 132 reports from years 2002 - 2018 most fires (15.9%) took place during February, and the least (1.5%) in September.
 Out of all 340 cases reported during the years 2002 - 2018, the most belonged to the categories: Overpressure Rupture (44.1%), Fire (38.8%), and Rescue & EMS (8.2%).
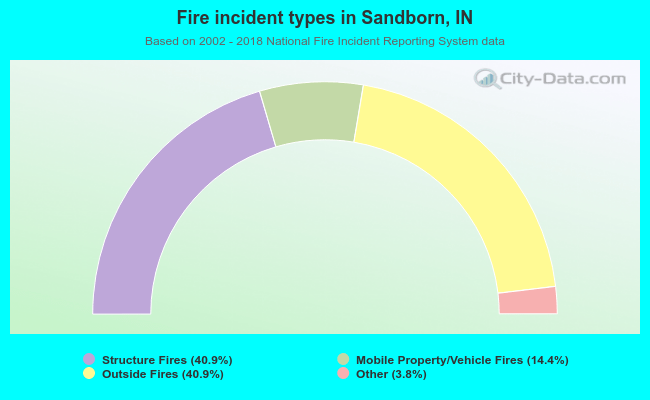 When looking into fire subcategories, the most incidents belonged to: Structure Fires (40.9%), and Outside Fires (40.9%).