| Fire incidents reported |
|---|
| Sreet name | Count |
|---|
| GRINDSTONE LAKE RD | 14 | | GRONINGEN RD | 14 | | 23 HWY | 12 | | OLD MILITARY RD | 12 | | COMMERCIAL AVE | 10 | | COURT AVE | 10 | | DELL RD | 10 | | PINE AVE | 10 | | FRIESLAND RD | 8 | | HWY 18 | 8 | | I35 HWY | 8 | | OLSON RD | 8 | | DUPUIS RD | 6 | | FRIESLAND RD | 6 | | GRONIGEN RD | 6 | | I-35 SB | 6 | | I35 | 6 | | LARK ST | 6 | | LITTLE SAND CREEK RD | 6 | | SJODAHL RD | 6 | | SKUNK LAKE RD | 6 | | STATE HWY 123 | 6 | | STATE HWY 123 HWY | 6 | | 100TH ST | 4 | | 510 5TH ST | 4 |
| | | Fire incidents reported |
|---|
| Sreet name | Count |
|---|
| AIRPORT RD | 4 | | ANDERSON RD | 4 | | CLOVERDALE RD | 4 | | DUXBURY RD | 4 | | FLEMING LOGGING RD | 4 | | FLEMMING LOGGING RD | 4 | | GRONIGEN RD | 4 | | HWY 123 | 4 | | HWY 23 | 4 | | I-35 | 4 | | I-35 NB HWY | 4 | | MINNESOTA ST | 4 | | ROBIN ST | 4 | | STATE HWY 23 HWY | 4 | | TENQUIST RD | 4 | | 104 MAIN AVE | 2 | | 120 LARK ST | 2 | | 122 ORIOLE ST SRT | 2 | | 12385 GRONINGEN RD | 2 | | 12385 GRONINGEN ROAD RD | 2 | | 1318 STATE HWY 23 HWY | 2 | | 1473 GROUSE ST | 2 | | 1910 COUNTY HWY 61 | 2 | | 1ST ST | 2 | | |
|
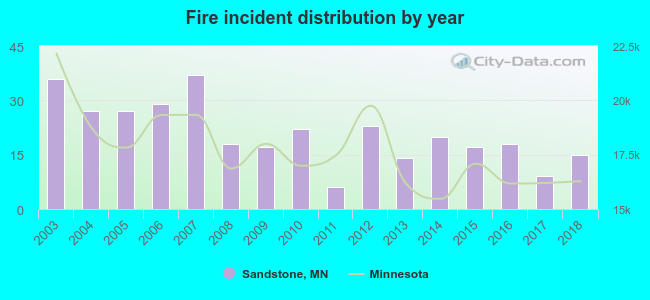 According to the data from the years 2003 - 2018 the average number of fires per year is 21. The highest number of fires - 37 took place in 2007, and the least - 6 in 2011. The data has a declining trend.
 31.0% incidents where reported in the morning and 69.0% in the evening. The most fires (16.1%) took place on Friday, and the least (13.1%) on Monday.
 According to the 336 reports from years 2003 - 2018 most fires (19.9%) took place during April, and the least (5.1%) in September.
 Out of all 559 cases reported during the years 2003 - 2018, the most belonged to the categories: Fire (60.1%), Overpressure Rupture (17.4%), and Rescue & EMS (12.5%).
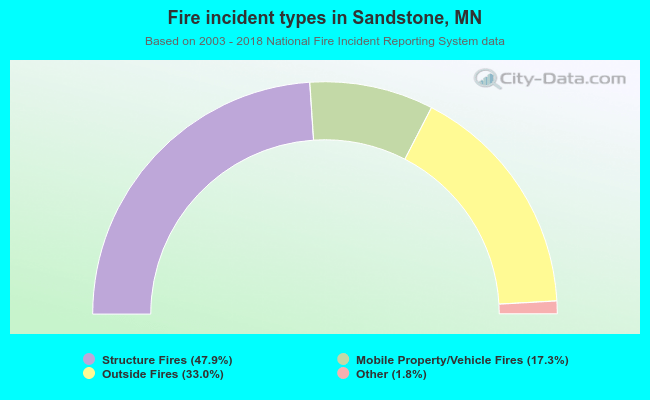 When looking into fire subcategories, the most reports belonged to: Structure Fires (47.9%), and Outside Fires (33.0%).