Scottville: Fire Incidents, Michigan (MI)
Where are fire incidents reported in Scottville, MI
Something went wrong! Please refresh the page.
|
| |||||||||||||||||||||||||||||||||||||||||||||||||||||||||||||||||||||||||||||||||||||||||||||||||||||||||||||
| Other | 134 | |||||||||||||||||||||||||||||||||||||||||||||||||||||||||||||||||||||||||||||||||||||||||||||||||||||||||||||
2002 - 2018 National Fire Incident Reporting System (NFIRS) incidents
- Incident types reported to NFIRS in Scottville, MI
- 1,19053.3%Rescue & EMS
- 46620.9%Fire
- 25611.5%Hazardous Condition
- 23610.6%Good Intent Call
- 542.4%Service Call
- 221.0%False Alarm
- 40.2%Special Incident
- 30.1%Overpressure Rupture
- Fire incident types reported to NFIRS in Scottville, MI
- 23650.6%Structure Fires
- 13328.5%Outside Fires
- 6714.4%Mobile Property/Vehicle Fires
- 306.4%Other
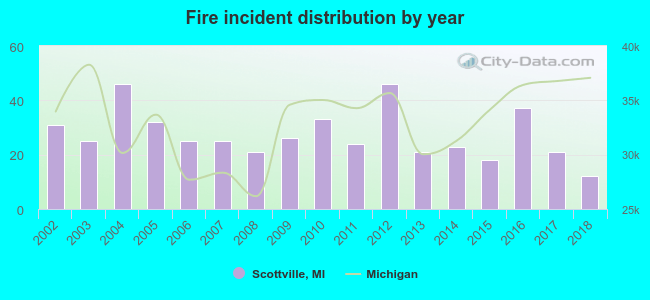 Based on the data from the years 2002 - 2018 the average number of fires per year is 27. The highest number of fire incidents - 46 took place in 2004, and the least - 12 in 2018. The data has a declining trend.
 32.0% incidents where reported in the morning and 68.0% in the evening. The most fires (15.9%) took place on Thursday, and the least (12.2%) on Tuesday.
 According to the 466 fire incidents from years 2002 - 2018 most fires (15.9%) took place during April, and the least (5.2%) in September.
 Out of all 2,233 cases reported during the years 2002 - 2018, the most belonged to the categories: Rescue & EMS (53.3%), Fire (20.9%), and Hazardous Condition (11.5%).
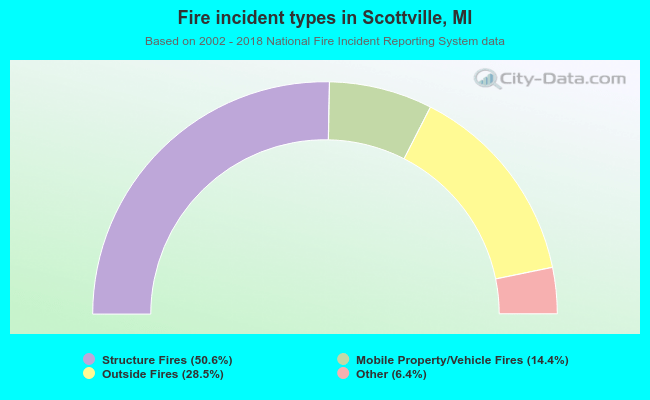 When looking into fire subcategories, the most reports belonged to: Structure Fires (50.6%), and Outside Fires (28.5%).