Severy: Fire Incidents, Kansas (KS)
Where are fire incidents reported in Severy, KS
Something went wrong! Please refresh the page.
|
| |||||||||||||||||||||||||||||||||||||||||||||||||||||||||||||||||||||||||||||||||||||||||||||||||||||||||||||
2002 - 2018 National Fire Incident Reporting System (NFIRS) incidents
- Incident types reported to NFIRS in Severy, KS
- 28281.7%Fire
- 267.5%Rescue & EMS
- 154.3%Good Intent Call
- 102.9%False Alarm
- 92.6%Hazardous Condition
- 10.3%Service Call
- 10.3%Severe Weather
- 10.3%Special Incident
- Fire incident types reported to NFIRS in Severy, KS
- 19167.7%Outside Fires
- 4014.2%Structure Fires
- 269.2%Other
- 258.9%Mobile Property/Vehicle Fires
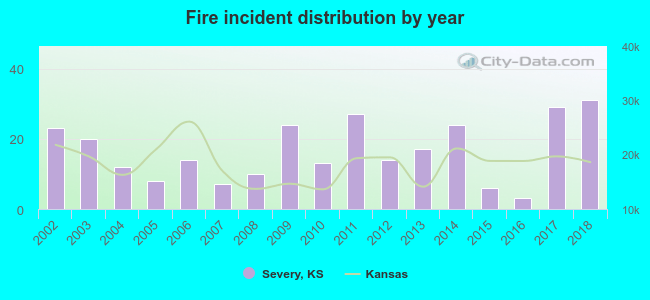 Based on the data from the years 2002 - 2018 the average number of fire incidents per year is 17. The highest number of fires - 31 took place in 2018, and the least - 3 in 2016. The data has an increasing trend.
 27.0% incidents where reported in the morning and 73.0% in the evening. The most fires (18.8%) took place on Saturday, and the least (9.9%) on Friday.
 According to the 282 incident reports from years 2002 - 2018 most fires (22.0%) took place during April, and the least (1.8%) in October.
 Out of all 345 cases reported during the years 2002 - 2018, the most belonged to the categories: Fire (81.7%), Overpressure Rupture (7.5%), and Service Call (4.3%).
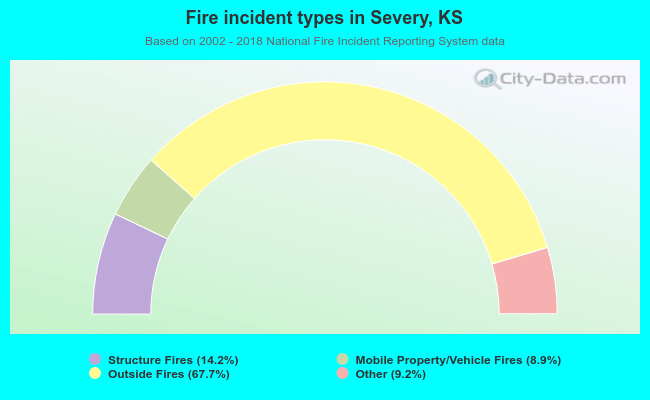 When looking into fire subcategories, the most reports belonged to: Outside Fires (67.7%), and Structure Fires (14.2%).