Sevierville: Fire Incidents, Tennessee (TN)
Where are fire incidents reported in Sevierville, TN
Something went wrong! Please refresh the page.
| Fire incidents reported | |
|---|---|
| Sreet name | Count |
| PARKWAY | 352 |
| WINFIELD DUNN PKY | 214 |
| DOLLY PARTON PKY | 134 |
| OLD NEWPORT HWY | 100 |
| CHAPMAN HWY | 98 |
| MIDDLE CREEK RD | 92 |
| MAIN ST | 82 |
| RIDGE RD | 76 |
| JONES COVE RD | 72 |
| NEWPORT HWY | 72 |
| DOUGLAS DAM RD | 70 |
| COLLIER DR | 66 |
| PARK RD | 66 |
| BOYDS CREEK HWY | 58 |
| ALLENSVILLE RD | 56 |
| OLD KNOXVILLE HWY | 56 |
| WEARS VALLEY ROAD RD | 54 |
| FORKS OF THE RIVER PKY | 50 |
| SIMS RD | 46 |
| UPPER MIDDLE CREEK RD | 38 |
| COVE RD | 36 |
| PITTMAN CENTER RD | 32 |
| VETERANS BLVD | 32 |
| MILLERS WAY 3001 | 30 |
| NEW ERA RD | 28 |
| BURDEN HILL RD | 24 |
| GISTS CREEK RD | 24 |
| WINFIELD DUNN | 24 |
| FLAT CREEK RD | 22 |
| PROVIDENCE RD | 22 |
| Other | 2,377 |
2003 - 2018 National Fire Incident Reporting System (NFIRS) incidents
- Incident types reported to NFIRS in Sevierville, TN
- 7,52640.8%Rescue & EMS
- 4,50324.4%Fire
- 2,34912.7%Good Intent Call
- 1,5418.4%Service Call
- 1,2937.0%False Alarm
- 1,1586.3%Hazardous Condition
- 320.2%Overpressure Rupture
- 230.1%Special Incident
- Fire incident types reported to NFIRS in Sevierville, TN
- 1,98544.1%Structure Fires
- 1,76939.3%Outside Fires
- 54412.1%Mobile Property/Vehicle Fires
- 2054.6%Other
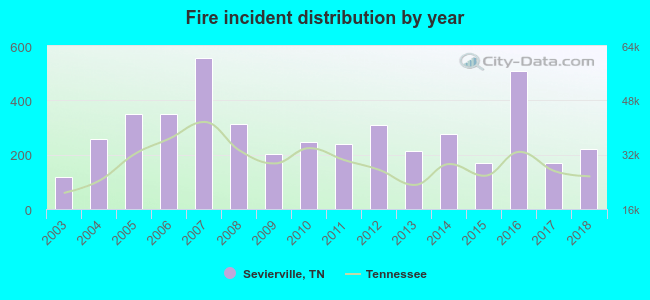 According to the data from the years 2003 - 2018 the average number of fires per year is 281. The highest number of reported fires - 556 took place in 2007, and the least - 116 in 2003. The data has an increasing trend.
The average number of yearly fire incidents per 10k residents in Sevierville, TN compared to nearest cities:
(Note: Based on data for the last 3 years, including only cities with population 5,000 and above)
| Sevierville: | 183.4 |
| Pigeon Forge: | 125.0 |
| Seymour: | 67.2 |
| Strawberry Plains: | 29.7 |
| Jefferson City: | 55.4 |
| Newport: | 185.1 |
| Knoxville: | 70.0 |
| Alcoa: | 64.4 |
| Maryville: | 76.7 |
 The median response time based on all reported fire incidents is 13 minutes. This is much higher compared to the state median value.
The median response time in Sevierville, TN compared to nearest cities:
(Note: Based on data for all years, including only cities with at least 500 fire incidents)
| Sevierville: | 13 minutes |
| Pigeon Forge: | 8 minutes |
| Gatlinburg: | 7 minutes |
| Seymour: | 8 minutes |
| Dandridge: | 10 minutes |
| New Market: | 6 minutes |
| Jefferson City: | 5 minutes |
| Newport: | 7 minutes |
| Knoxville: | 5 minutes |
 Based on the data from the years 2003 - 2018 the average number of fire-related fatalities per year is 1. The highest number of reported deaths - 3 took place in 2006, and the lowest - 0 in 2003. The data has an increasing trend.
The average number of fatalities per 1,000 fires is 2. This indicator was the highest - 9 in 2006, and the lowest 0 in 2003. The trend for fatalities per 1,000 fires is increasing. Compared to the state value the number of fatalities per 1,000 fire incidents is lower.
Based on the data from the years 2003 - 2018 the average number of fire-related fatalities per year is 1. The highest number of reported deaths - 3 took place in 2006, and the lowest - 0 in 2003. The data has an increasing trend.
The average number of fatalities per 1,000 fires is 2. This indicator was the highest - 9 in 2006, and the lowest 0 in 2003. The trend for fatalities per 1,000 fires is increasing. Compared to the state value the number of fatalities per 1,000 fire incidents is lower.Deaths per 1,000 incidents in Sevierville, TN compared to nearest cities:
(Note: Based on data for all years, including only cities with at least 2,500 fire incidents)
| Sevierville: | 2.7 |
| Gatlinburg: | 5.2 |
| Knoxville: | 2.1 |
| Maryville: | 2.8 |
| Morristown: | 4.3 |
 Based on the reports from the years 2003 - 2018 the average number of fire-related yearly casualties is 1. The highest number of reported injuries - 2 took place in 2017, and the lowest - 0 in 2003. The data has a rising trend.
The average number of injuries per 1,000 fires is 3. This indicator was the highest - 12 in 2017, and the lowest 0 in 2003. The trend for injuries per 1,000 fire incidents is growing. Compared to the Tennessee value the number of injuries per 1,000 fire incidents is much lower.
Based on the reports from the years 2003 - 2018 the average number of fire-related yearly casualties is 1. The highest number of reported injuries - 2 took place in 2017, and the lowest - 0 in 2003. The data has a rising trend.
The average number of injuries per 1,000 fires is 3. This indicator was the highest - 12 in 2017, and the lowest 0 in 2003. The trend for injuries per 1,000 fire incidents is growing. Compared to the Tennessee value the number of injuries per 1,000 fire incidents is much lower.Casualties per 1,000 incidents in Sevierville, TN compared to nearest cities:
(Note: Based on data for all years, including only cities with at least 500 fire incidents)
| Sevierville: | 2.2 |
| Pigeon Forge: | 6.8 |
| Gatlinburg: | 2.6 |
| Seymour: | 10.4 |
| Dandridge: | 3.3 |
| New Market: | 19.9 |
| Jefferson City: | 4.5 |
| Newport: | 0.4 |
| Knoxville: | 8.2 |
 30.8% incidents where reported in the morning and 69.2% in the evening. The most fires (20.7%) took place on Monday, and the least (12.4%) on Wednesday.
 According to the 4,503 incident reports from years 2003 - 2018 most fires (13.0%) took place during November, and the least (5.9%) in December.
 Out of all 18,433 cases reported during the years 2003 - 2018, the most belonged to the categories: Rescue & EMS (40.8%), Fire (24.4%), and Good Intent Call (12.7%).
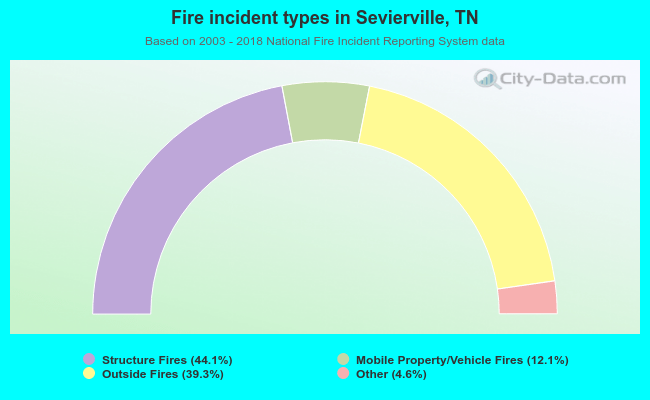 When looking into fire subcategories, the most reports belonged to: Structure Fires (44.1%), and Outside Fires (39.3%).