Shelburne Falls: Fire Incidents, Massachusetts (MA)
Where are fire incidents reported in Shelburne Falls, MA
Something went wrong! Please refresh the page.
|
| |||||||||||||||||||||||||||||||||||||||||||||||||||||||||||||||||||||||||||||||||||||||||||||||||||||||||||||
2002 - 2018 National Fire Incident Reporting System (NFIRS) incidents
- Incident types reported to NFIRS in Shelburne Falls, MA
- 16825.5%Fire
- 16725.3%False Alarm
- 15824.0%Hazardous Condition
- 619.3%Service Call
- 446.7%Good Intent Call
- 406.1%Rescue & EMS
- 132.0%Overpressure Rupture
- 60.9%Severe Weather
- 20.3%Special Incident
- Fire incident types reported to NFIRS in Shelburne Falls, MA
- 9254.8%Structure Fires
- 4929.2%Outside Fires
- 158.9%Other
- 127.1%Mobile Property/Vehicle Fires
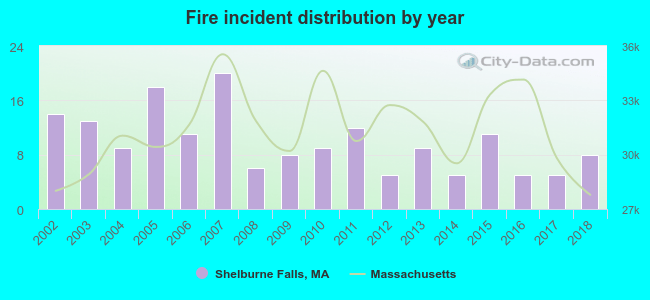 Based on the data from the years 2002 - 2018 the average number of fire incidents per year is 10. The highest number of fires - 20 took place in 2007, and the least - 5 in 2012. The data has a dropping trend.
 38.7% incidents where reported in the morning and 61.3% in the evening. The most fires (19.6%) took place on Monday, and the least (10.7%) on Thursday.
 According to the 168 incident reports from years 2002 - 2018 most fires (14.9%) took place during April, and the least (2.4%) in June.
 Out of all 659 cases reported during the years 2002 - 2018, the most belonged to the categories: Fire (25.5%), False Alarm (25.3%), and Hazardous Condition (24.0%).
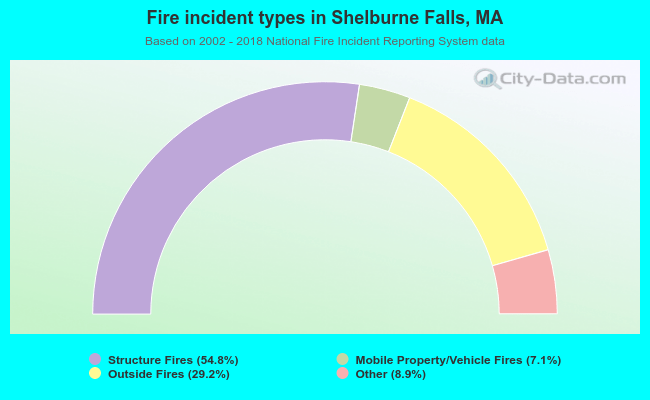 When looking into fire subcategories, the most incidents belonged to: Structure Fires (54.8%), and Outside Fires (29.2%).