| Fire incidents reported |
|---|
| Sreet name | Count |
|---|
| 31 | 28 | | 31 HWY | 22 | | 79 | 12 | | HWY 31 | 12 | | EARL CHADICK RD | 10 | | JIM FORD RD | 10 | | LAKE ST | 10 | | MCKINNEY RD | 10 | | TRULOCK BAY RD | 8 | | 15 HWY | 6 | | 31 HWY | 6 | | HIGHWAY 79 | 6 | | HIGHWAY 79 NORTH | 6 | | HWY 15 | 6 | | 15 | 4 | | 31 AND | 4 | | 7600 HIGHWAY 79 | 4 | | 7707 EARL CHADICK RD | 4 | | 79 HWY | 4 | | BAYOU ST | 4 | | CHESTNUT ST | 4 | | DANAHER RD | 4 | | MAIN ST | 4 | | MITCHELL RD | 4 | | PACK | 4 |
| | | Fire incidents reported |
|---|
| Sreet name | Count |
|---|
| PACK RD | 4 | | PACK ROAD | 4 | | WATKINS RD | 4 | | 100 HWY 31 | 2 | | 10100 HWY 31 | 2 | | 1220 S. PACK RD | 2 | | 15 & JACK JONES HWY | 2 | | 15 AND | 2 | | 15 CORNFIELD | 2 | | 15 RD | 2 | | 1ST | 2 | | 204 BAYOU LANE | 2 | | 204 BAYOU ST | 2 | | 204 W BAYOU ST | 2 | | 31 | 2 | | 31 & ST. MARY'S | 2 | | 31 15 HWY | 2 | | 31 AND VEGINE RD | 2 | | 31 AND WALKER RD | 2 | | 31 MITCHELL RD | 2 | | 3201 HOURSESHOE LAKE RD | 2 | | 3604 EARL CHADICK RD | 2 | | 4009 HIGHWAY 31 | 2 | | 5100 EARL CHADICK RD | 2 | | 5600 EARL CHADDICK RD | 2 |
|
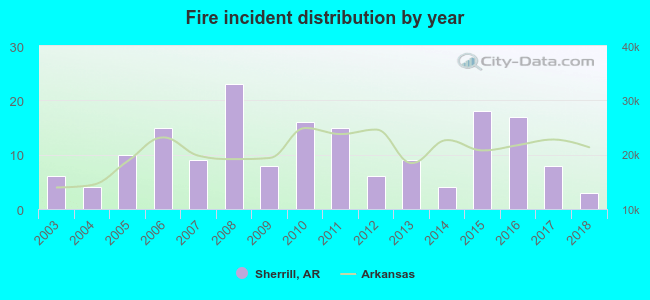 Based on the data from the years 2003 - 2018 the average number of fires per year is 11. The highest number of fires - 23 took place in 2008, and the least - 3 in 2018. The data has a dropping trend.
 21.6% incidents where reported in the morning and 78.4% in the evening. The most fires (25.1%) took place on Saturday, and the least (8.8%) on Thursday.
 According to the 171 fires from years 2003 - 2018 most fires (13.5%) took place during January, and the least (4.1%) in December.
 Out of all 216 cases reported during the years 2003 - 2018, the most belonged to the categories: Fire (79.2%), Hazardous Condition (8.3%), and Service Call (5.1%).
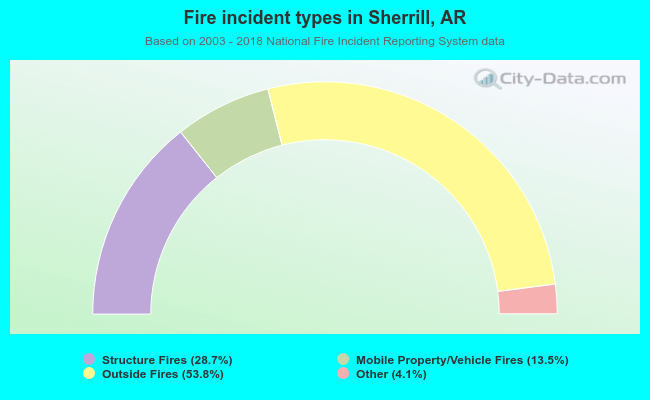 When looking into fire subcategories, the most reports belonged to: Outside Fires (53.8%), and Structure Fires (28.7%).