Show Low: Fire Incidents, Arizona (AZ)
Where are fire incidents reported in Show Low, AZ
Something went wrong! Please refresh the page.
|
| |||||||||||||||||||||||||||||||||||||||||||||||||||||||||||||||||||||||||||||||||||||||||||||||||||||||||||||
2004 - 2018 National Fire Incident Reporting System (NFIRS) incidents
- Incident types reported to NFIRS in Show Low, AZ
- 2,12336.2%Rescue & EMS
- 1,78630.5%Special Incident
- 5399.2%Fire
- 5158.8%Service Call
- 4718.0%Hazardous Condition
- 3375.7%Good Intent Call
- 901.5%False Alarm
- Fire incident types reported to NFIRS in Show Low, AZ
- 29755.1%Outside Fires
- 15027.8%Structure Fires
- 539.8%Mobile Property/Vehicle Fires
- 397.2%Other
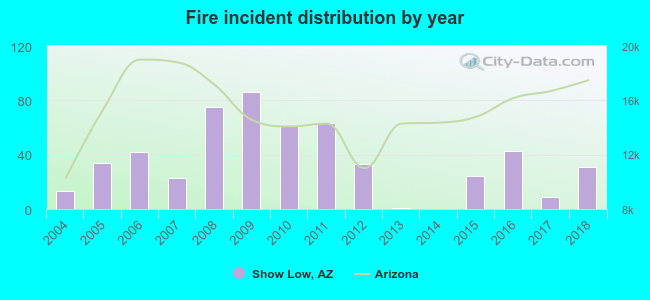 Based on the data from the years 2004 - 2018 the average number of fire incidents per year is 36. The highest number of fire incidents - 86 took place in 2009, and the least - 0 in 2014. The data has a growing trend.
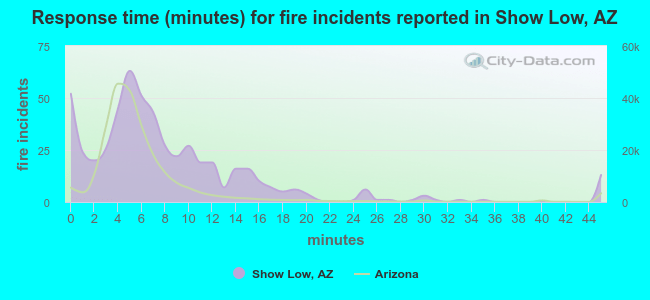 The median response time based on all reported fire incidents is 6 minutes. This is about the same as the state median value.
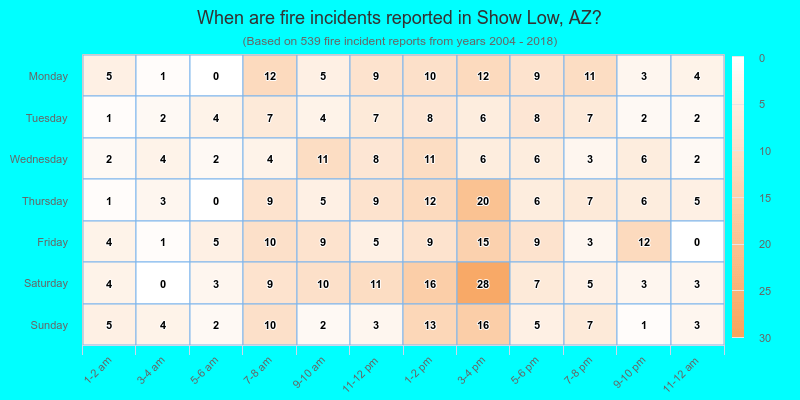
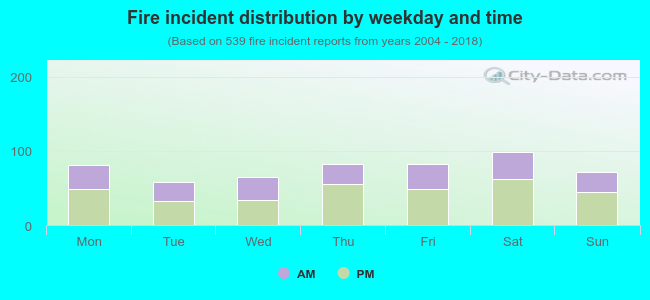 39.3% incidents where reported in the morning and 60.7% in the evening. The most fires (18.4%) took place on Saturday, and the least (10.8%) on Tuesday.
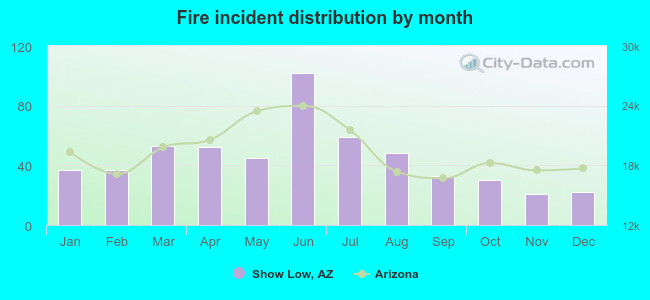 According to the 539 fire incidents from years 2004 - 2018 most fires (18.9%) took place during June, and the least (3.9%) in November.
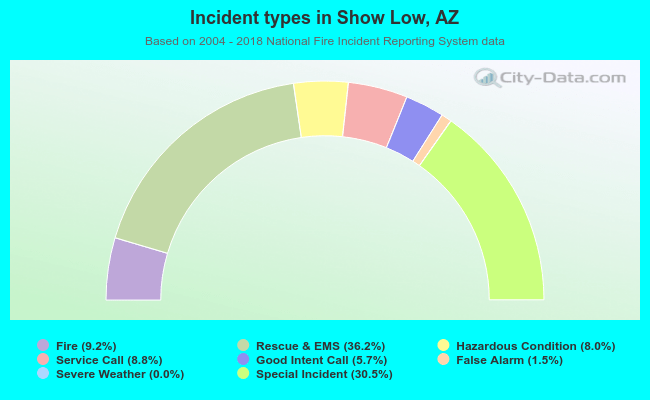 Out of all 5,862 cases reported during the years 2004 - 2018, the most belonged to the categories: Overpressure Rupture (36.2%), Severe Weather (30.5%), and Fire (9.2%).
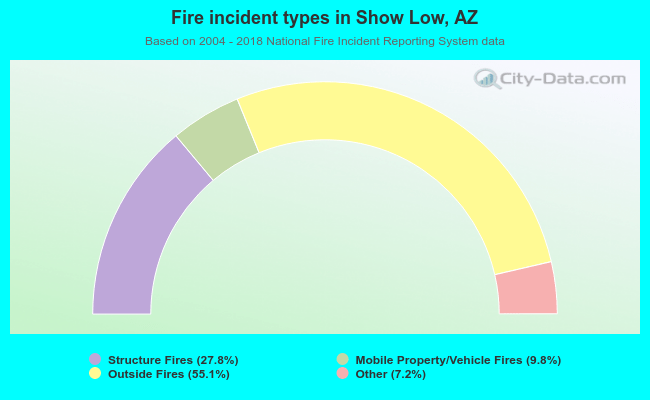 When looking into fire subcategories, the most incidents belonged to: Outside Fires (55.1%), and Structure Fires (27.8%).