| Fire incidents reported |
|---|
| Sreet name | Count |
|---|
| WEST ST | 14 | | MAIN ST | 10 | | UNKNOWN | 8 | | 1 ST ST | 6 | | 1150TH ST | 6 | | 14949 N PARK | 4 | | 1700TH | 4 | | 1800TH AVE | 4 | | 2000TH AVE | 4 | | 600TH ST | 4 | | BEECHER ST | 4 | | NORTH ST | 4 | | US HWY 33 | 4 | | 000 N. / 775 E. | 2 | | 10434 E FAYETTE ROAD | 2 | | 1060TH ST | 2 | | 1150TH. ST | 2 | | 11625 19775ST | 2 | | 11941 N 900TH ST. | 2 | | 1450TH AVE | 2 | | 14949 N PARK RD. | 2 | | 1600 AVE | 2 | | 1600TH AVE | 2 | | 1600TH AVE. | 2 | | 1600TH AVE850TH | 2 |
| | | Fire incidents reported |
|---|
| Sreet name | Count |
|---|
| 1700TH AVE | 2 | | 1735TH AVE | 2 | | 1750 AVE LAKE SHORE DRIVE | 2 | | 17TH AVE | 2 | | 1800 AVE | 2 | | 1875TH AVE | 2 | | 19253 N. 800 ST. | 2 | | 19488 N 1150 ST | 2 | | 1ST ST | 2 | | 2000 AVE | 2 | | 2000 ST | 2 | | 2000AVE/ 1150E | 2 | | 208 NORTH 6TH STREET | 2 | | 208 WEST MARKET | 2 | | 305 WEST MAIN | 2 | | 306 W. MAIN | 2 | | 306 W.MAIN | 2 | | 4TH STRE | 2 | | 500 - 1800TH | 2 | | 500TH | 2 | | 501 WEST MAIN | 2 | | 600TH STRE | 2 | | 700TH | 2 | | 700TH STRE | 2 | | 7773 E 1500 TH AVE | 2 |
|
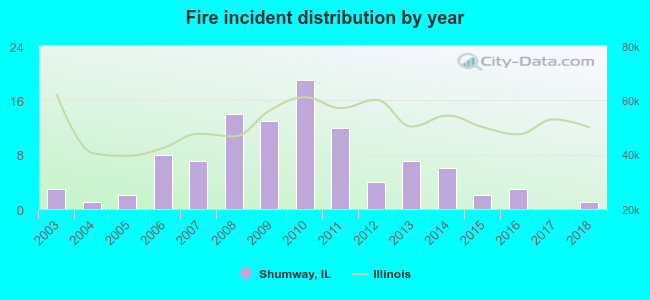 Based on the data from the years 2003 - 2018 the average number of fire incidents per year is 6. The highest number of fires - 19 took place in 2010, and the least - 0 in 2017. The data has a decreasing trend.
 38.2% incidents where reported in the morning and 61.8% in the evening. The most fires (20.6%) took place on Monday, and the least (4.9%) on Thursday.
 According to the 102 incident reports from years 2003 - 2018 most fires (16.7%) took place during September, and the least (2.9%) in April.
 Out of all 171 cases reported during the years 2003 - 2018, the most belonged to the categories: Fire (59.6%), Overpressure Rupture (19.3%), and Rescue & EMS (9.4%).
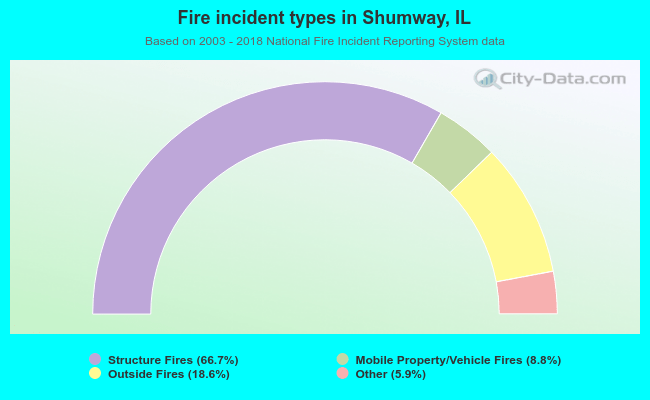 When looking into fire subcategories, the most reports belonged to: Structure Fires (66.7%), and Outside Fires (18.6%).