Sidney: Fire Incidents, Nebraska (NE)
Where are fire incidents reported in Sidney, NE
Something went wrong! Please refresh the page.
|
| |||||||||||||||||||||||||||||||||||||||||||||||||||||||||||||||||||||||||||||||||||||||||||||||||||||||||||||
| Other | 57 | |||||||||||||||||||||||||||||||||||||||||||||||||||||||||||||||||||||||||||||||||||||||||||||||||||||||||||||
2003 - 2018 National Fire Incident Reporting System (NFIRS) incidents
- Incident types reported to NFIRS in Sidney, NE
- 32150.4%Fire
- 11317.7%Hazardous Condition
- 8713.7%Rescue & EMS
- 568.8%False Alarm
- 355.5%Good Intent Call
- 223.5%Service Call
- 20.3%Overpressure Rupture
- 10.2%Severe Weather
- Fire incident types reported to NFIRS in Sidney, NE
- 19560.7%Outside Fires
- 6821.2%Structure Fires
- 4413.7%Mobile Property/Vehicle Fires
- 144.4%Other
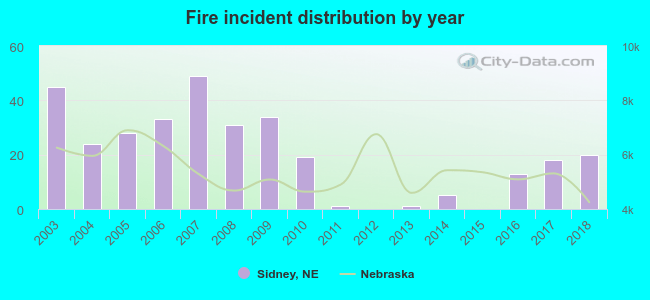 Based on the data from the years 2003 - 2018 the average number of fire incidents per year is 20. The highest number of fires - 49 took place in 2007, and the least - 0 in 2012. The data has a decreasing trend.
The average number of yearly fire incidents per 10k residents in Sidney, NE compared to nearest cities:
(Note: Based on data for the last 3 years, including only cities with population 5,000 and above)
| Sidney: | 24.6 |
| Gering: | 61.3 |
| Scottsbluff: | 59.8 |
| Alliance: | 5.9 |
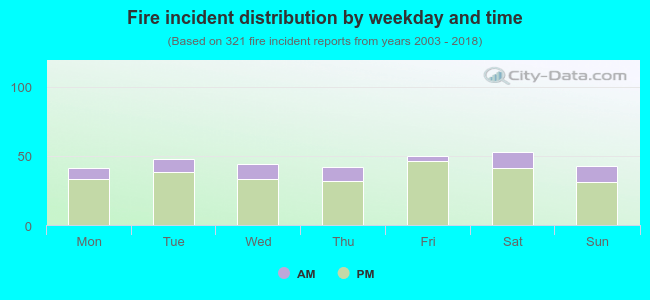 20.9% incidents where reported in the morning and 79.1% in the evening. The most fires (16.5%) took place on Saturday, and the least (12.8%) on Monday.
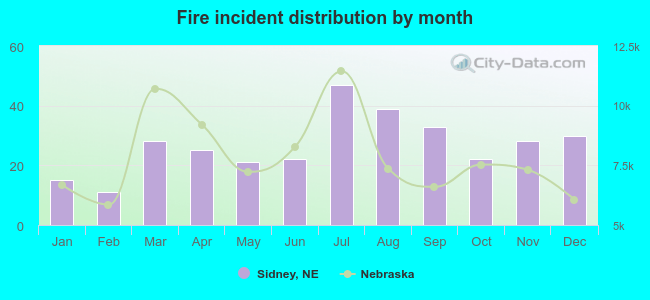 Based on the 321 fire incidents from years 2003 - 2018 most fires (14.6%) took place during July, and the least (3.4%) in February.
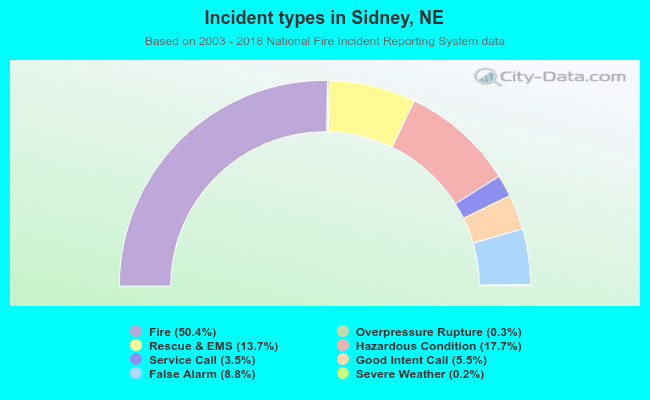 Out of all 637 cases reported during the years 2003 - 2018, the most belonged to the categories: Fire (50.4%), Hazardous Condition (17.7%), and Rescue & EMS (13.7%).
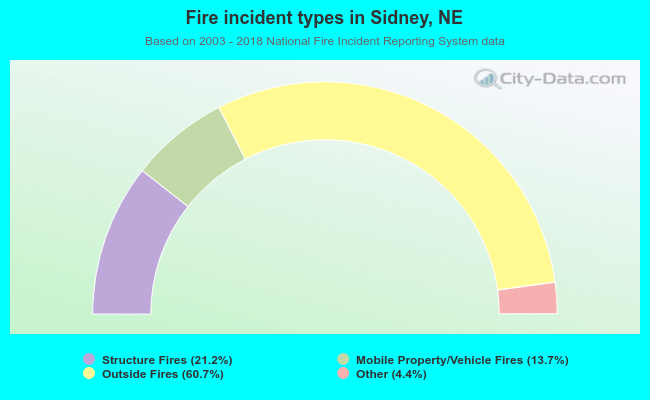 When looking into fire subcategories, the most reports belonged to: Outside Fires (60.7%), and Structure Fires (21.2%).