Sleepy Hollow: Fire Incidents, New York (NY)
Where are fire incidents reported in Sleepy Hollow, NY
Something went wrong! Please refresh the page.
|
| |||||||||||||||||||||||||||||||||||||||||||||||||||||||||||||||||||||||||||||||||||||||||||||||||||||||||||||
2003 - 2018 National Fire Incident Reporting System (NFIRS) incidents
- Incident types reported to NFIRS in Sleepy Hollow, NY
- 43742.0%Hazardous Condition
- 25324.3%Fire
- 16616.0%False Alarm
- 716.8%Rescue & EMS
- 676.4%Service Call
- 201.9%Good Intent Call
- 101.0%Overpressure Rupture
- 80.8%Severe Weather
- 80.8%Special Incident
- Fire incident types reported to NFIRS in Sleepy Hollow, NY
- 14155.7%Structure Fires
- 6324.9%Outside Fires
- 3011.9%Mobile Property/Vehicle Fires
- 197.5%Other
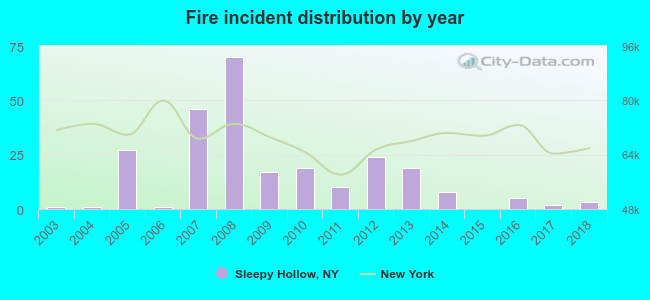 According to the data from the years 2003 - 2018 the average number of fires per year is 16. The highest number of fire incidents - 70 took place in 2008, and the least - 0 in 2015. The data has a growing trend.
The average number of yearly fire incidents per 10k residents in Sleepy Hollow, NY compared to nearest cities:
(Note: Based on data for the last 3 years, including only cities with population 5,000 and above)
| Sleepy Hollow: | 3.3 |
| Tarrytown: | 8.4 |
| Nyack: | 3.8 |
| Briarcliff Manor: | 10.4 |
| Irvington: | 18.2 |
| Valley Cottage: | 30.4 |
| Greenburgh: | 6.7 |
| Pleasantville: | 6.3 |
| Ossining: | 12.8 |
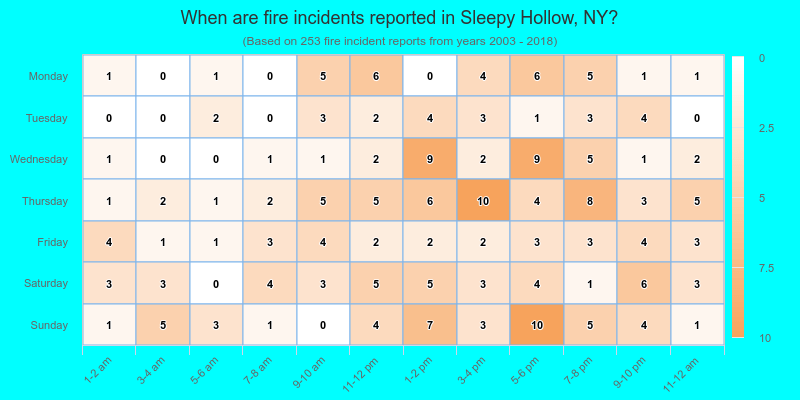
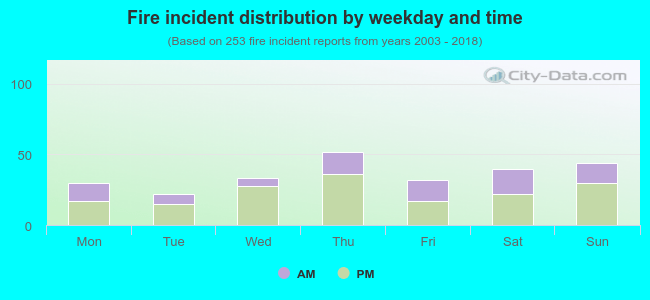 34.8% incidents where reported in the morning and 65.2% in the evening. The most fires (20.6%) took place on Thursday, and the least (8.7%) on Tuesday.
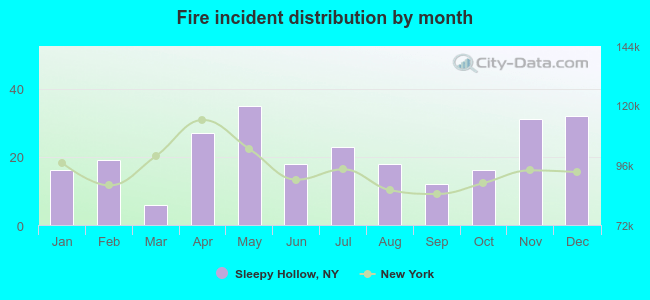 Based on the 253 reports from years 2003 - 2018 most fires (13.8%) took place during May, and the least (2.4%) in March.
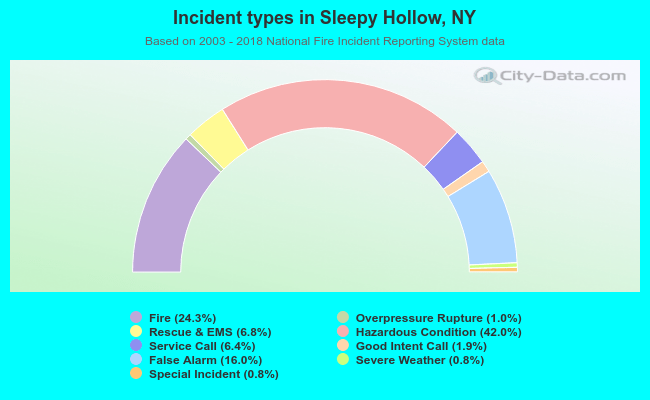 Out of all 1,040 cases reported during the years 2003 - 2018, the most belonged to the categories: Hazardous Condition (42.0%), Fire (24.3%), and False Alarm (16.0%).
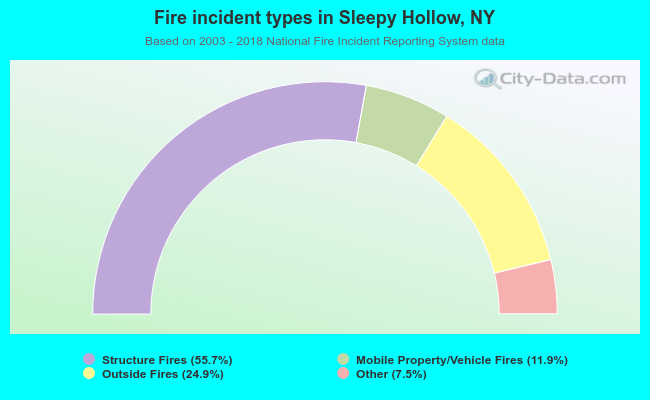 When looking into fire subcategories, the most incidents belonged to: Structure Fires (55.7%), and Outside Fires (24.9%).