Somerset: Fire Incidents, Massachusetts (MA)
Where are fire incidents reported in Somerset, MA
Something went wrong! Please refresh the page.
| Fire incidents reported | |
|---|---|
| Sreet name | Count |
| COUNTY ST | 176 |
| GRAND ARMY HWY | 94 |
| GAR HWY | 82 |
| RIVERSIDE AVE | 62 |
| WILBUR AVE | 52 |
| MAIN ST | 36 |
| READ ST | 28 |
| E RT 195 HWY | 26 |
| BRAYTON AVE | 24 |
| BRAYTON PT RD | 24 |
| LEES RIVER AVE | 24 |
| PROSPECT ST | 22 |
| CHACE ST | 18 |
| E RTE 195 HWY | 18 |
| SLADES FERRY AVE | 18 |
| SIMBROM DR | 16 |
| DWELLY RD | 14 |
| BUFFINTON ST | 12 |
| CLEARVIEW AVE | 12 |
| HIGH ST | 12 |
| REGAN RD | 12 |
| WHETSTONE HILL RD | 12 |
| BUXTON AVE | 10 |
| HAUTE DR | 10 |
| RANDALL AVE | 10 |
| SOUTH ST | 10 |
| CHATTERTON AVE | 8 |
| ELM ST | 8 |
| FENO CT | 8 |
| GIBBS ST | 8 |
2002 - 2018 National Fire Incident Reporting System (NFIRS) incidents
- Incident types reported to NFIRS in Somerset, MA
- 11,64068.9%Rescue & EMS
- 2,05712.2%Service Call
- 9835.8%Hazardous Condition
- 8935.3%False Alarm
- 7024.2%Fire
- 5203.1%Good Intent Call
- 920.5%Special Incident
- Fire incident types reported to NFIRS in Somerset, MA
- 26437.6%Structure Fires
- 23633.6%Outside Fires
- 12217.4%Mobile Property/Vehicle Fires
- 8011.4%Other
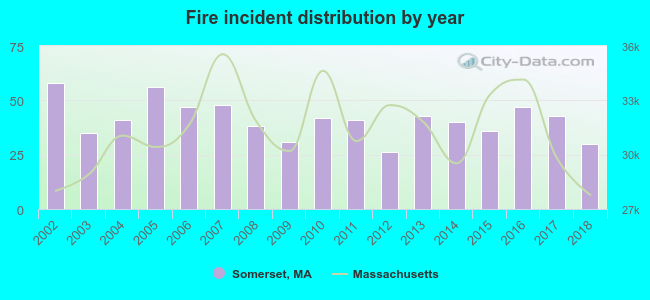 Based on the data from the years 2002 - 2018 the average number of fire incidents per year is 41. The highest number of fires - 58 took place in 2002, and the least - 26 in 2012. The data has a dropping trend.
The average number of yearly fire incidents per 10k residents in Somerset, MA compared to nearest cities:
(Note: Based on data for the last 3 years, including only cities with population 5,000 and above)
| Somerset: | 22.0 |
| Swansea: | 42.2 |
| Fall River: | 48.8 |
| Dighton: | 12.7 |
| Berkley: | 25.0 |
| Freetown: | 4.5 |
| Rehoboth: | 33.9 |
| Westport: | 41.0 |
| Seekonk: | 48.1 |
 The median response time based on all reported fire incidents is 6 minutes. This is higher than the Massachusetts median value.
The median response time in Somerset, MA compared to nearest cities:
(Note: Based on data for all years, including only cities with at least 500 fire incidents)
| Somerset: | 6 minutes |
| Swansea: | 7 minutes |
| Fall River: | 5 minutes |
| Rehoboth: | 6 minutes |
| Westport: | 5 minutes |
| Seekonk: | 6 minutes |
| Taunton: | 4 minutes |
| Lakeville: | 6 minutes |
| New Bedford: | 4 minutes |
 Based on the data from the years 2002 - 2018 the average number of fire-related yearly casualties is 1. The highest number of casualties - 5 took place in 2012, and the lowest - 0 in 2002. The data has a constant trend.
The average number of casualties per 1,000 fire incidents is 21. This indicator was the highest - 192 in 2012, and the lowest 0 in 2002. The trend for injuries per 1,000 incidents is constant. Compared to the Massachusetts value the number of casualties per 1,000 fire incidents is higher.
Based on the data from the years 2002 - 2018 the average number of fire-related yearly casualties is 1. The highest number of casualties - 5 took place in 2012, and the lowest - 0 in 2002. The data has a constant trend.
The average number of casualties per 1,000 fire incidents is 21. This indicator was the highest - 192 in 2012, and the lowest 0 in 2002. The trend for injuries per 1,000 incidents is constant. Compared to the Massachusetts value the number of casualties per 1,000 fire incidents is higher.Casualties per 1,000 incidents in Somerset, MA compared to nearest cities:
(Note: Based on data for all years, including only cities with at least 500 fire incidents)
| Somerset: | 17.1 |
| Swansea: | 9.5 |
| Fall River: | 26.2 |
| Rehoboth: | 10.5 |
| Westport: | 15.5 |
| Seekonk: | 11.2 |
| Taunton: | 0.8 |
| Lakeville: | 0.0 |
| New Bedford: | 21.2 |
 28.3% incidents where reported in the morning and 71.7% in the evening. The most fires (15.4%) took place on Tuesday, and the least (13.2%) on Wednesday.
 Based on the 702 fires from years 2002 - 2018 most fires (13.4%) took place during April, and the least (5.8%) in January.
 Out of all 16,898 cases reported during the years 2002 - 2018, the most belonged to the categories: Rescue & EMS (68.9%), Service Call (12.2%), and Hazardous Condition (5.8%).
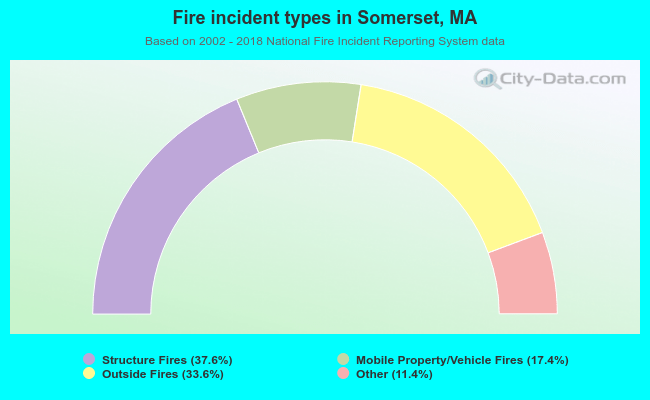 When looking into fire subcategories, the most reports belonged to: Structure Fires (37.6%), and Outside Fires (33.6%).