South Kingstown: Fire Incidents, Rhode Island (RI)
Where are fire incidents reported in South Kingstown, RI
Something went wrong! Please refresh the page.
|
| |||||||||||||||||||||||||||||||||||||||||||||||||||||||||||||||||||||||||||||||||||||||||||||||||||||||||||||
2007 - 2018 National Fire Incident Reporting System (NFIRS) incidents
- Incident types reported to NFIRS in South Kingstown, RI
- 99733.5%False Alarm
- 68623.1%Rescue & EMS
- 47816.1%Hazardous Condition
- 45115.2%Fire
- 1876.3%Service Call
- 1725.8%Good Intent Call
- 30.1%Severe Weather
- Fire incident types reported to NFIRS in South Kingstown, RI
- 25356.1%Structure Fires
- 11124.6%Outside Fires
- 5412.0%Mobile Property/Vehicle Fires
- 337.3%Other
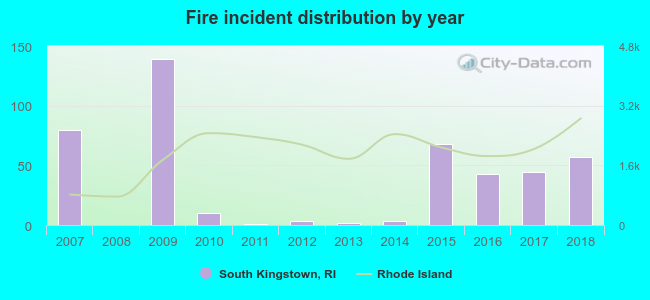 According to the data from the years 2007 - 2018 the average number of fire incidents per year is 38. The highest number of fire incidents - 139 took place in 2009, and the least - 0 in 2008. The data has a dropping trend.
The average number of yearly fire incidents per 10k residents in South Kingstown, RI compared to nearest cities:
(Note: Based on data for the last 3 years, including only cities with population 5,000 and above)
| South Kingstown: | 15.7 |
| Kingston: | 35.8 |
| Narragansett: | 31.3 |
| Richmond: | 11.7 |
| Charlestown: | 25.6 |
| Exeter: | 64.9 |
| Jamestown: | 16.7 |
| North Kingstown: | 5.3 |
| Newport: | 19.2 |
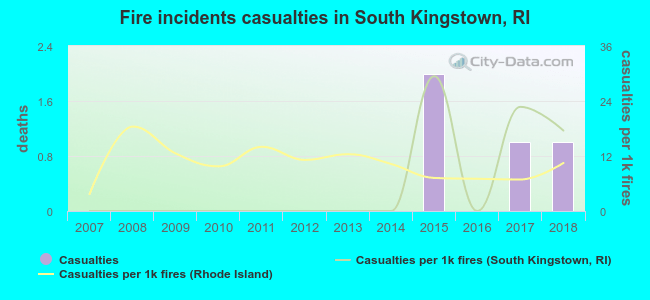 According to the reports from the years 2007 - 2018 the average number of fire-related casualties per year is 0. The highest number of reported injuries - 2 took place in 2015, and the lowest - 0 in 2007. The data has a growing trend.
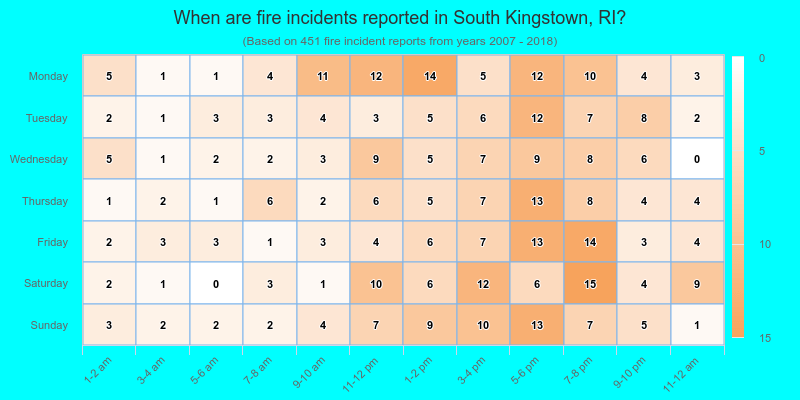
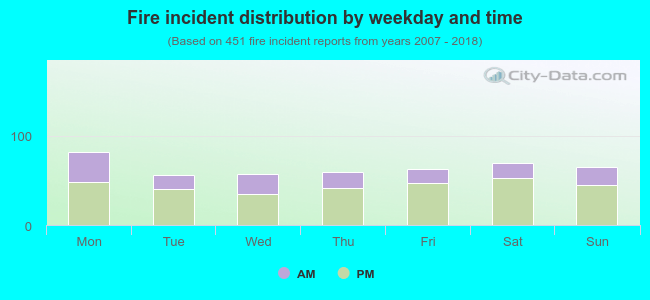 31.7% incidents where reported in the morning and 68.3% in the evening. The most fires (18.2%) took place on Monday, and the least (12.4%) on Tuesday.
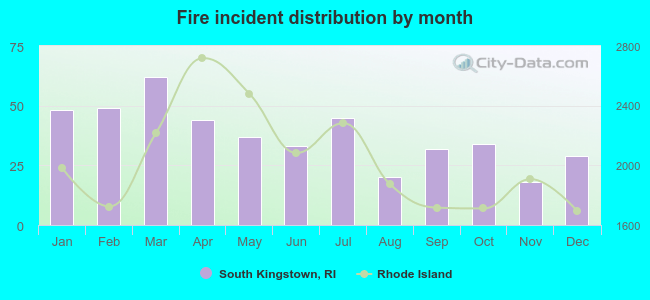 Based on the 451 fire incident reports from years 2007 - 2018 most fires (13.7%) took place during March, and the least (4.0%) in November.
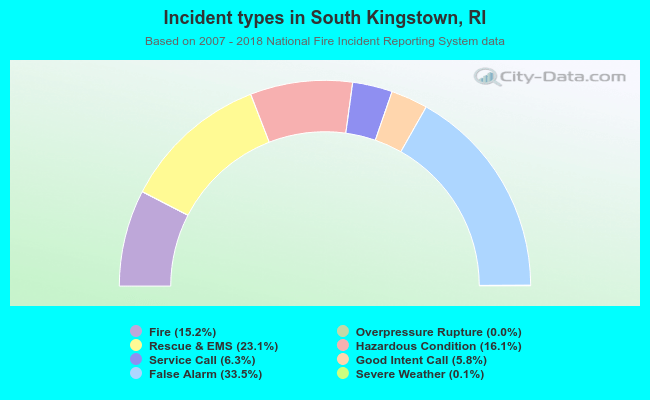 Out of all 2,975 cases reported during the years 2007 - 2018, the most belonged to the categories: False Alarm (33.5%), Rescue & EMS (23.1%), and Hazardous Condition (16.1%).
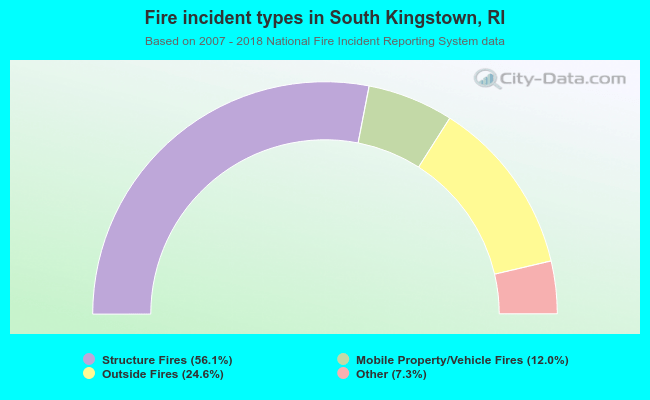 When looking into fire subcategories, the most incidents belonged to: Structure Fires (56.1%), and Outside Fires (24.6%).