| Fire incidents reported |
|---|
| Sreet name | Count |
|---|
| I24 | 26 | | I 24 | 16 | | SOUTH PITTSBURG MOUNTAIN RD | 16 | | PATTON SCHOOL RD | 12 | | BATTLECREEK RD | 10 | | 745 19TH ST | 8 | | CUMBERLAND AVE | 8 | | I-24 | 8 | | I24E | 8 | | I24W | 8 | | SOUTH PITTSBURG MTN RD | 8 | | 974 PATTON SCHOOL RD | 6 | | BATTLE CREEK ROAD | 6 | | CEDAR AVE | 6 | | GOURDNECK COVE ROAD | 6 | | HOLLY AVENUE | 6 | | HWY 2 | 6 | | HWY 72 | 6 | | I-24 WESTBOUND | 6 | | I24WEST | 6 | | IRONDALE ROAD | 6 | | 110 NORTH BIRCH AVE | 4 | | 1205 HOLLY AVE | 4 | | 121 CAMPBELL ROAD | 4 | | 12TH STREET | 4 |
| | | Fire incidents reported |
|---|
| Sreet name | Count |
|---|
| 19TH ST | 4 | | 19TH STREET | 4 | | 2650 ELLIS RD | 4 | | 509 19TH ST | 4 | | 660 HARGISS COVE RD | 4 | | 800 BLOCK 19TH ST | 4 | | 999 HARGISS COVE RD | 4 | | BERRYHILL RD | 4 | | BIRCH AVENUE | 4 | | BROWNS TRACE RD | 4 | | ELLIS RD | 4 | | ELM AVE | 4 | | HEMLOCK DR | 4 | | HEWGLEY RD | 4 | | HIGHWAY 156 WEST HWY | 4 | | HOLLY AVE | 4 | | HWY 156 | 4 | | I-24W | 4 | | MARION AVE | 4 | | PROSPECT | 4 | | RAULSTON TOWN RD | 4 | | SECOND ST | 4 | | SIXTH ST | 4 | | SWEETENS COVE ROAD | 4 | | |
|
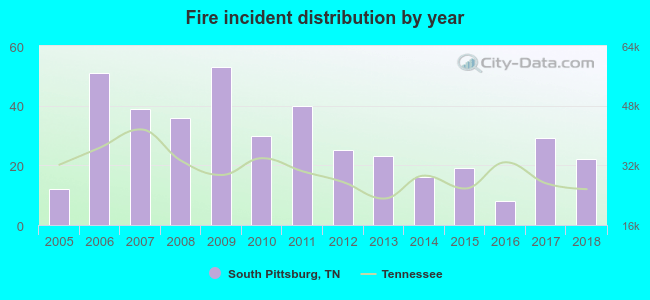 Based on the data from the years 2005 - 2018 the average number of fires per year is 29. The highest number of fire incidents - 53 took place in 2009, and the least - 8 in 2016. The data has a growing trend.
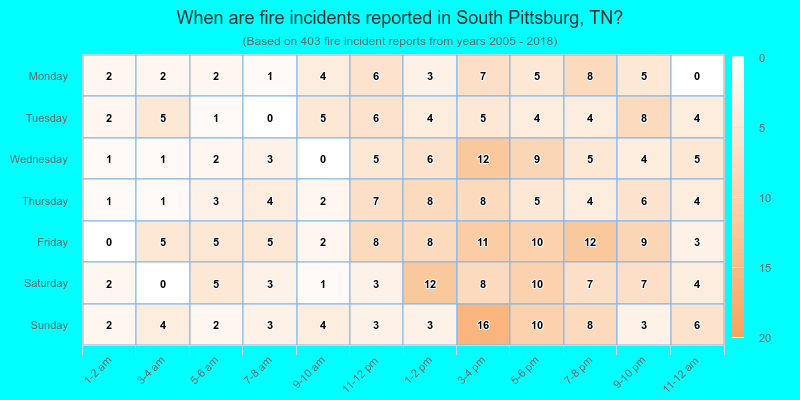
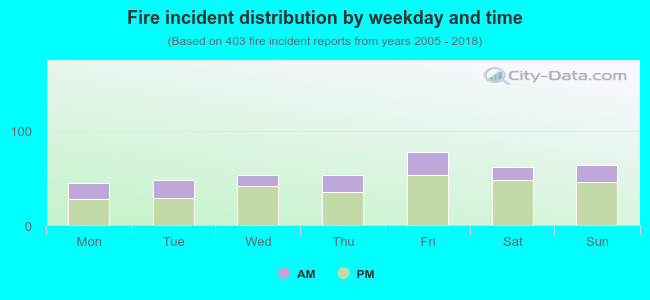 30.5% incidents where reported in the morning and 69.5% in the evening. The most fires (19.4%) took place on Friday, and the least (11.2%) on Monday.
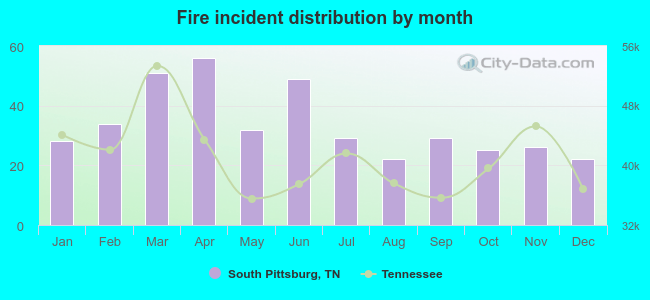 According to the 403 fire incidents from years 2005 - 2018 most fires (13.9%) took place during April, and the least (5.5%) in August.
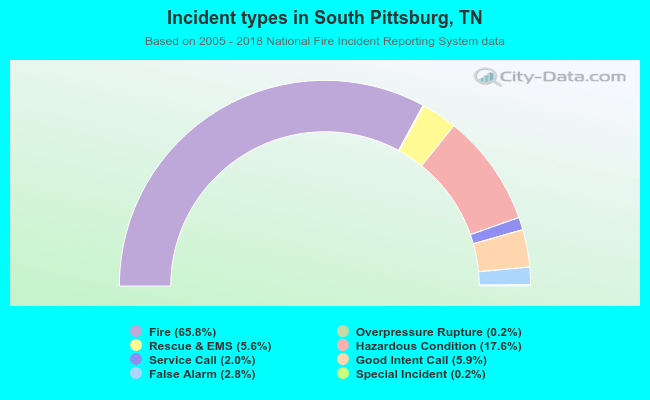 Out of all 612 cases reported during the years 2005 - 2018, the most belonged to the categories: Fire (65.8%), Hazardous Condition (17.6%), and Good Intent Call (5.9%).
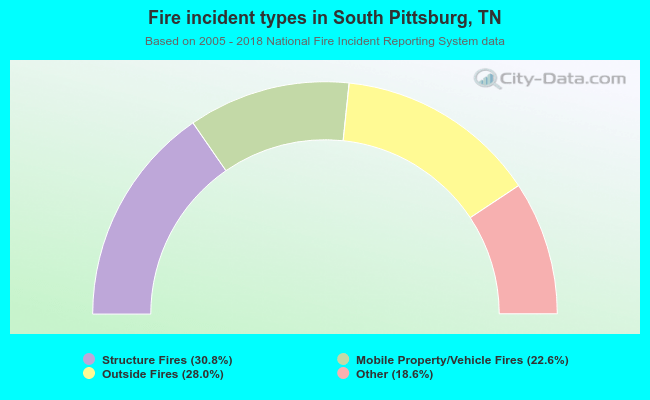 When looking into fire subcategories, the most reports belonged to: Structure Fires (30.8%), and Outside Fires (28.0%).