South Roxana: Fire Incidents, Illinois (IL)
Where are fire incidents reported in South Roxana, IL
Something went wrong! Please refresh the page.
|
| |||||||||||||||||||||||||||||||||||||||||||||||||||||||||||||||||||||||||||||||||||||||||||||||||||||||||||||
2002 - 2018 National Fire Incident Reporting System (NFIRS) incidents
- Incident types reported to NFIRS in South Roxana, IL
- 1,17861.4%Rescue & EMS
- 31016.2%Fire
- 1558.1%Hazardous Condition
- 1558.1%Service Call
- 643.3%Good Intent Call
- 522.7%False Alarm
- 30.2%Overpressure Rupture
- Fire incident types reported to NFIRS in South Roxana, IL
- 15951.3%Structure Fires
- 10433.5%Outside Fires
- 3411.0%Mobile Property/Vehicle Fires
- 134.2%Other
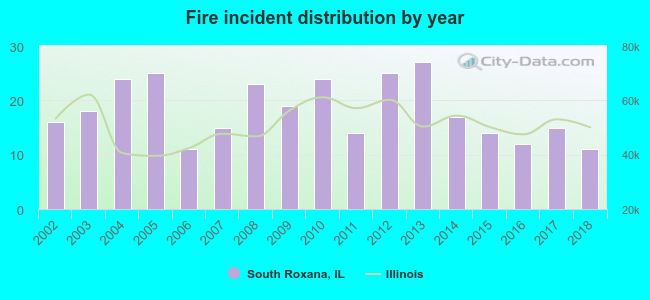 Based on the data from the years 2002 - 2018 the average number of fire incidents per year is 18. The highest number of fires - 27 took place in 2013, and the least - 11 in 2006. The data has a declining trend.
 33.2% incidents where reported in the morning and 66.8% in the evening. The most fires (18.4%) took place on Tuesday, and the least (10.3%) on Monday.
 Based on the 310 fire incidents from years 2002 - 2018 most fires (13.9%) took place during July, and the least (5.8%) in August.
 Out of all 1,918 cases reported during the years 2002 - 2018, the most belonged to the categories: Rescue & EMS (61.4%), Fire (16.2%), and Hazardous Condition (8.1%).
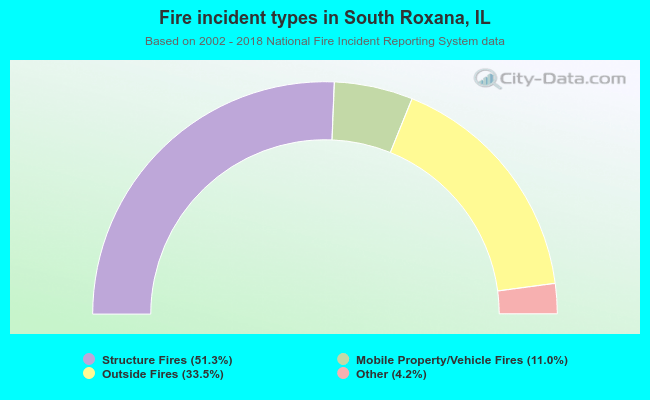 When looking into fire subcategories, the most reports belonged to: Structure Fires (51.3%), and Outside Fires (33.5%).