Southbridge: Fire Incidents, Massachusetts (MA)
Where are fire incidents reported in Southbridge, MA
Something went wrong! Please refresh the page.
| Fire incidents reported | |
|---|---|
| Sreet name | Count |
| MAIN ST | 212 |
| CHARLTON ST | 158 |
| WORCESTER ST | 136 |
| VILLAGE DR | 98 |
| HAMILTON ST | 82 |
| SOUTH ST | 68 |
| CENTRAL ST | 64 |
| ELM ST | 52 |
| MECHANIC ST | 48 |
| NORTH ST | 48 |
| PLEASANT ST | 48 |
| EASTFORD RD | 40 |
| ASHLAND AVE | 38 |
| CROSS ST | 38 |
| EVERETT ST | 38 |
| CHAPIN ST | 34 |
| DENNISON DR | 32 |
| RIVER ST | 32 |
| BAREFOOT RD | 30 |
| WOODSTOCK RD | 28 |
| LEBANON HILL RD | 26 |
| MILL ST | 26 |
| COOMBS ST | 24 |
| DRESSER ST | 24 |
| MORRIS ST | 24 |
| PINE ST | 24 |
| WEST ST | 24 |
| CHESTNUT ST | 22 |
| HENRY ST | 22 |
| NORTH WOODSTOCK RD | 22 |
2002 - 2018 National Fire Incident Reporting System (NFIRS) incidents
- Incident types reported to NFIRS in Southbridge, MA
- 3,27336.3%Rescue & EMS
- 1,62018.0%Hazardous Condition
- 1,40115.5%Fire
- 1,22513.6%False Alarm
- 7528.3%Service Call
- 5786.4%Good Intent Call
- 1361.5%Special Incident
- 180.2%Overpressure Rupture
- Fire incident types reported to NFIRS in Southbridge, MA
- 84260.1%Structure Fires
- 34024.3%Outside Fires
- 16111.5%Mobile Property/Vehicle Fires
- 584.1%Other
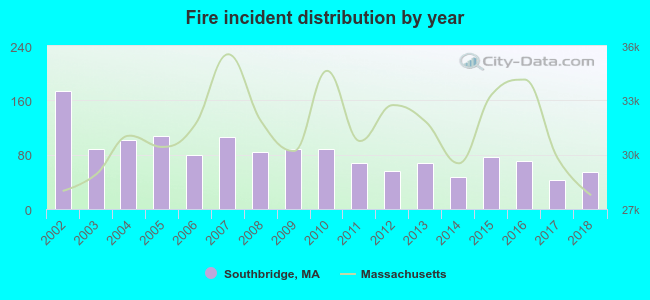 According to the data from the years 2002 - 2018 the average number of fire incidents per year is 82. The highest number of reported fires - 174 took place in 2002, and the least - 42 in 2017. The data has a decreasing trend.
The average number of yearly fire incidents per 10k residents in Southbridge, MA compared to nearest cities:
(Note: Based on data for the last 3 years, including only cities with population 5,000 and above)
| Southbridge: | 40.9 |
| Charlton: | 51.9 |
| Dudley: | 36.3 |
| Webster: | 65.7 |
| Oxford: | 162.8 |
| Spencer: | 109.9 |
| Leicester: | 33.7 |
| Auburn: | 39.3 |
| Monson: | 31.2 |
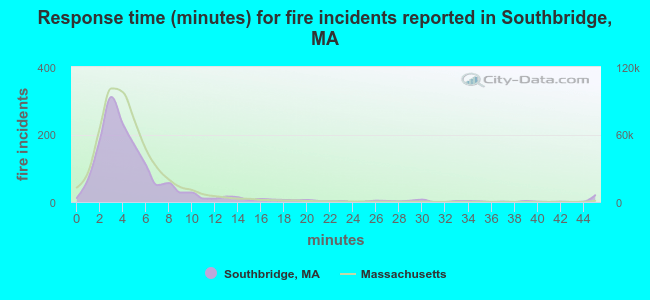 The median response time based on all reported fire incidents is 4 minutes. This is similar to the state median value.
The median response time in Southbridge, MA compared to nearest cities:
(Note: Based on data for all years, including only cities with at least 500 fire incidents)
| Southbridge: | 4 minutes |
| Sturbridge: | 9 minutes |
| Charlton: | 8 minutes |
| Dudley: | 9 minutes |
| Webster: | 8 minutes |
| Oxford: | 8 minutes |
| Spencer: | 7 minutes |
| Leicester: | 5 minutes |
| Auburn: | 4 minutes |
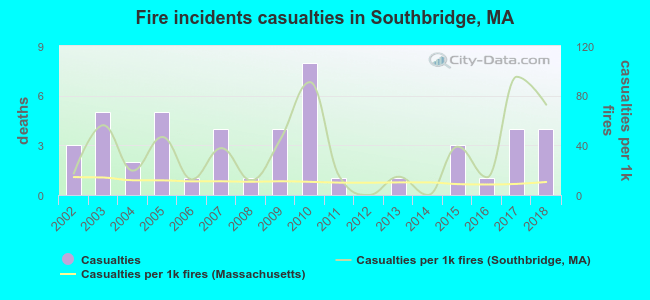 Based on the reports from the years 2002 - 2018 the average number of fire-related casualties per year is 3. The highest number of casualties - 8 took place in 2010, and the lowest - 0 in 2012. The data has a growing trend.
The average number of casualties per 1,000 fire incidents is 35. This indicator was the highest - 95 in 2017, and the lowest 0 in 2012. The trend for injuries per 1,000 incidents is rising. Compared to the Massachusetts value the number of casualties per 1,000 fires is much higher.
Based on the reports from the years 2002 - 2018 the average number of fire-related casualties per year is 3. The highest number of casualties - 8 took place in 2010, and the lowest - 0 in 2012. The data has a growing trend.
The average number of casualties per 1,000 fire incidents is 35. This indicator was the highest - 95 in 2017, and the lowest 0 in 2012. The trend for injuries per 1,000 incidents is rising. Compared to the Massachusetts value the number of casualties per 1,000 fires is much higher.
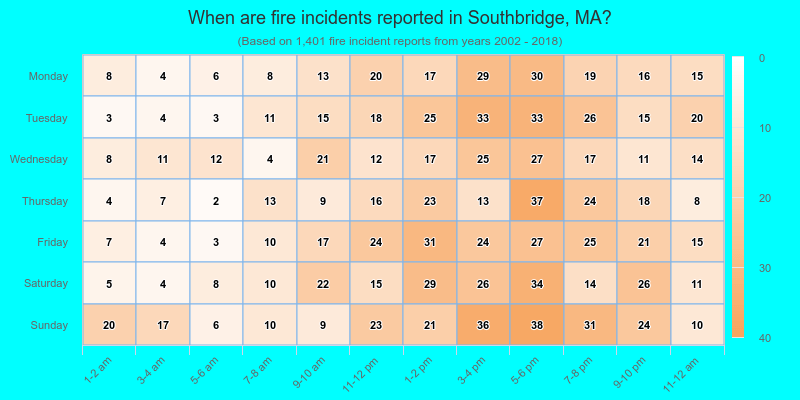
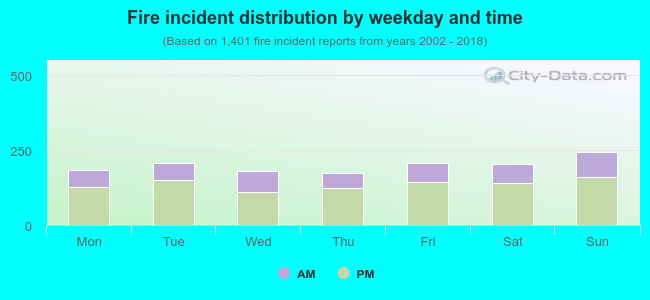 31.8% incidents where reported in the morning and 68.2% in the evening. The most fires (17.5%) took place on Sunday, and the least (12.4%) on Thursday.
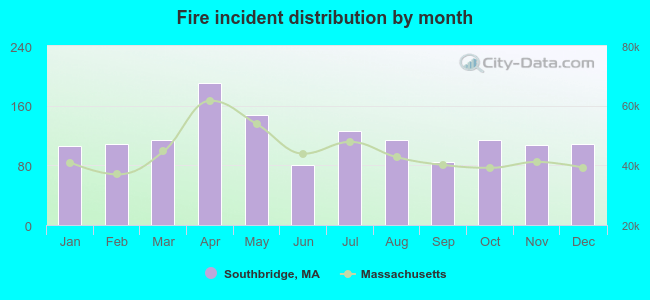 Based on the 1,401 incident reports from years 2002 - 2018 most fires (13.6%) took place during April, and the least (5.7%) in June.
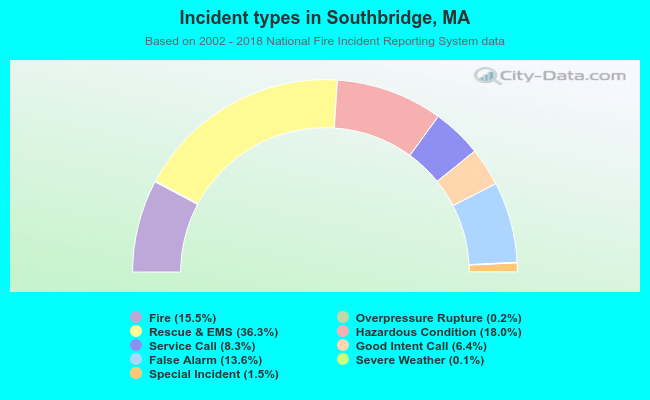 Out of all 9,011 cases reported during the years 2002 - 2018, the most belonged to the categories: Rescue & EMS (36.3%), Hazardous Condition (18.0%), and Fire (15.5%).
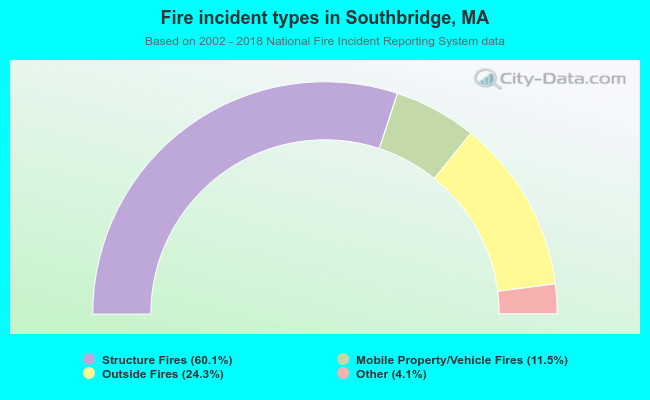 When looking into fire subcategories, the most reports belonged to: Structure Fires (60.1%), and Outside Fires (24.3%).