Spring Lake Heights: Fire Incidents, New Jersey (NJ)
Where are fire incidents reported in Spring Lake Heights, NJ
Something went wrong! Please refresh the page.
|
| |||||||||||||||||||||||||||||||||||||||||||||||||||||||||||||||||||||||||||||||||||||||||||||||||||||||||||||
2002 - 2018 National Fire Incident Reporting System (NFIRS) incidents
- Incident types reported to NFIRS in Spring Lake Heights, NJ
- 31143.1%Hazardous Condition
- 15421.3%False Alarm
- 15321.2%Fire
- 365.0%Rescue & EMS
- 283.9%Good Intent Call
- 233.2%Service Call
- 141.9%Severe Weather
- 20.3%Overpressure Rupture
- 10.1%Special Incident
- Fire incident types reported to NFIRS in Spring Lake Heights, NJ
- 9964.7%Structure Fires
- 3321.6%Outside Fires
- 149.2%Other
- 74.6%Mobile Property/Vehicle Fires
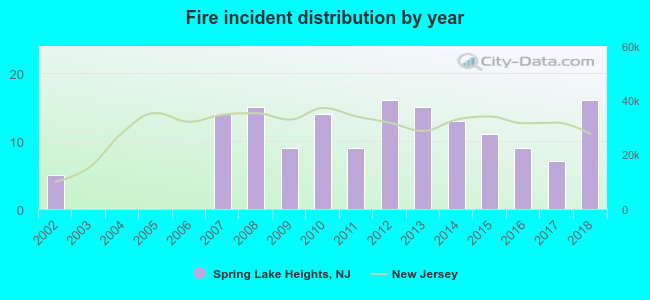 Based on the data from the years 2002 - 2018 the average number of fire incidents per year is 9. The highest number of reported fires - 16 took place in 2012, and the least - 0 in 2003. The data has a rising trend.
 According to the data from the years 2002 - 2018 the average number of fire-related casualties per year is 0. The highest number of reported injuries - 1 took place in 2010, and the lowest - 0 in 2002. The data has a rising trend.
 20.9% incidents where reported in the morning and 79.1% in the evening. The most fires (17.0%) took place on Wednesday, and the least (11.1%) on Saturday.
 Based on the 153 fires from years 2002 - 2018 most fires (12.4%) took place during January, and the least (4.6%) in February.
 Out of all 722 cases reported during the years 2002 - 2018, the most belonged to the categories: Hazardous Condition (43.1%), False Alarm (21.3%), and Fire (21.2%).
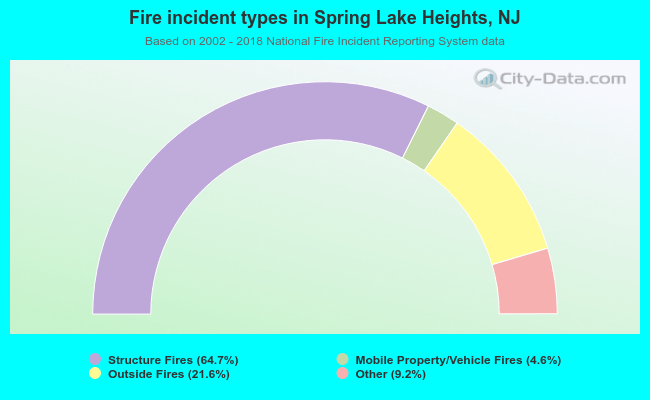 When looking into fire subcategories, the most incidents belonged to: Structure Fires (64.7%), and Outside Fires (21.6%).