Spring Valley: Fire Incidents, Illinois (IL)
Where are fire incidents reported in Spring Valley, IL
Something went wrong! Please refresh the page.
|
| |||||||||||||||||||||||||||||||||||||||||||||||||||||||||||||||||||||||||||||||||||||||||||||||||||||||||||||
2002 - 2018 National Fire Incident Reporting System (NFIRS) incidents
- Incident types reported to NFIRS in Spring Valley, IL
- 1,12559.9%Rescue & EMS
- 30116.0%Fire
- 19310.3%Hazardous Condition
- 1829.7%False Alarm
- 442.3%Service Call
- 251.3%Good Intent Call
- 50.3%Special Incident
- Fire incident types reported to NFIRS in Spring Valley, IL
- 14146.8%Structure Fires
- 10033.2%Outside Fires
- 4314.3%Mobile Property/Vehicle Fires
- 175.6%Other
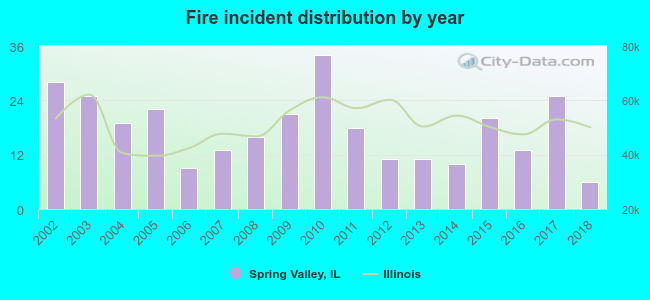 Based on the data from the years 2002 - 2018 the average number of fire incidents per year is 18. The highest number of reported fire incidents - 34 took place in 2010, and the least - 6 in 2018. The data has a declining trend.
The average number of yearly fire incidents per 10k residents in Spring Valley, IL compared to nearest cities:
(Note: Based on data for the last 3 years, including only cities with population 5,000 and above)
| Spring Valley: | 27.4 |
| Peru: | 40.9 |
| La Salle: | 2.7 |
| Princeton: | 61.1 |
| Mendota: | 56.5 |
| Ottawa: | 33.3 |
| Streator: | 79.0 |
| Chillicothe: | 113.6 |

 34.9% incidents where reported in the morning and 65.1% in the evening. The most fires (16.3%) took place on Tuesday, and the least (12.3%) on Friday.
 According to the 301 incident reports from years 2002 - 2018 most fires (12.0%) took place during April, and the least (5.3%) in October.
 Out of all 1,877 cases reported during the years 2002 - 2018, the most belonged to the categories: Rescue & EMS (59.9%), Fire (16.0%), and Hazardous Condition (10.3%).
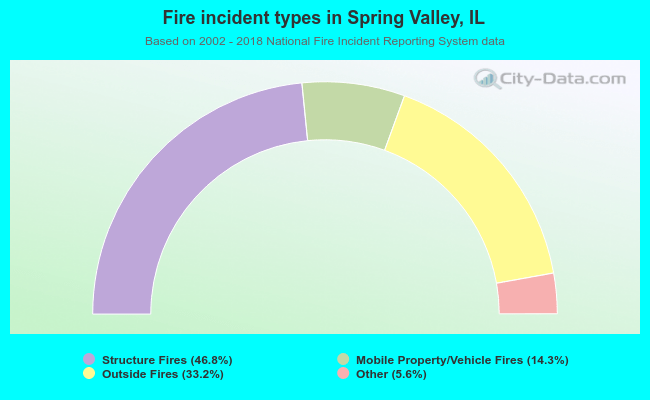 When looking into fire subcategories, the most incidents belonged to: Structure Fires (46.8%), and Outside Fires (33.2%).