| Fire incidents reported |
|---|
| Sreet name | Count |
|---|
| NW 10TH AVE | 10 | | NE 20TH STREET | 6 | | 2ND | 4 | | 3RD | 4 | | NW 20TH AVE. | 4 | | SANTA FE | 4 | | SE 20TH STREET | 4 | | US HWY 281 | 4 | | 120TH STREET | 2 | | 140TH ST | 2 | | 211 SE 30TH AVE | 2 | | 211 SE 30TH AVE. | 2 | | 309 E. 4TH | 2 | | 407 E. SECOND | 2 | | 40TH ST | 2 | | 421 W 3RD STREET | 2 | | 4TH | 2 | | 4TH ST | 2 | | 507 N. MAIN | 2 | | 50TH | 2 | | 605 N. PRAIRIE | 2 | | 7 S. 50-281, 1 W. 1/2 S. | 2 | | 70TH AVE. | 2 | | 913 NW 50TH AVE | 2 | | BROCK | 2 |
| | | Fire incidents reported |
|---|
| Sreet name | Count |
|---|
| FIRST | 2 | | HIGHWAY 281 | 2 | | MONROE | 2 | | NE 105TH AVE | 2 | | NE 10TH AVE | 2 | | NE 60TH STREET | 2 | | NW 10TH. STREET | 2 | | NW 120TH ST., NW 50TH AV | 2 | | NW 120TH STREET | 2 | | NW 30TH AVE | 2 | | NW 30TH STREET | 2 | | NW 40TH STREET | 2 | | NW 70TH STREET | 2 | | PEARL | 2 | | PRAIRE | 2 | | PRAIRIE | 2 | | SE 30TH AVE | 2 | | SE 30TH STREET | 2 | | SE 60TH STREET | 2 | | SW 20TH STREET | 2 | | SW 30TH AVE | 2 | | SW 30TH STREET | 2 | | SW 5TH AVE | 2 | | US HWY 50 | 2 | | |
|
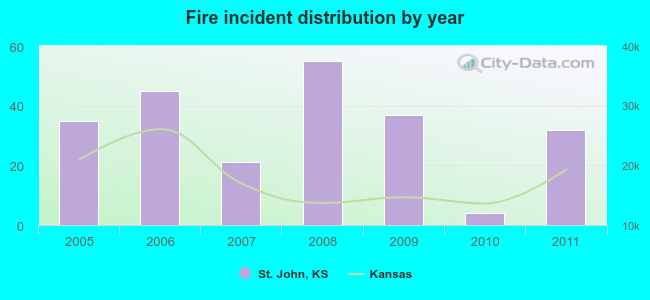 Based on the data from the years 2005 - 2011 the average number of fire incidents per year is 33. The highest number of reported fire incidents - 55 took place in 2008, and the least - 4 in 2010. The data has a decreasing trend.
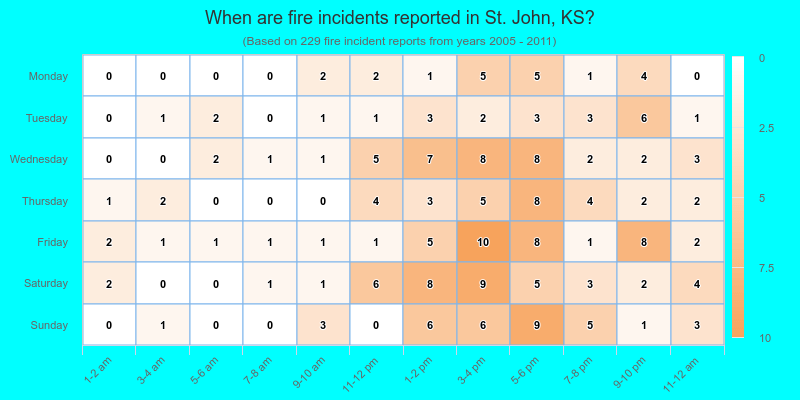
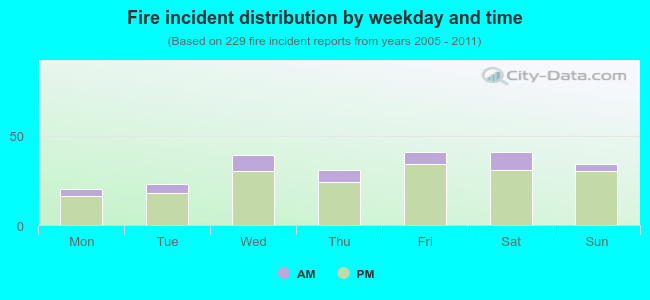 20.1% incidents where reported in the morning and 79.9% in the evening. The most fires (17.9%) took place on Friday, and the least (8.7%) on Monday.
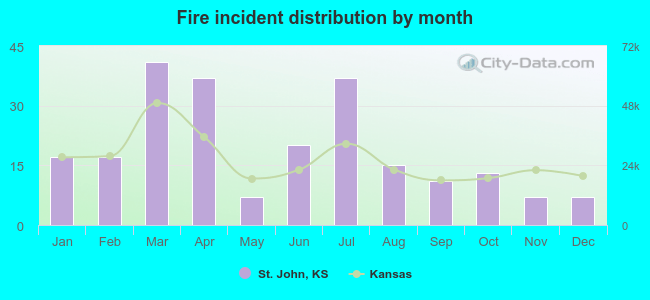 According to the 229 incident reports from years 2005 - 2011 most fires (17.9%) took place during March, and the least (3.1%) in May.
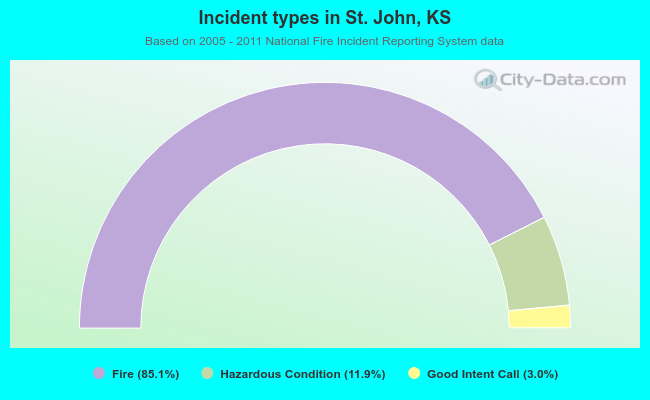 Out of all 269 cases reported during the years 2005 - 2011, the most belonged to the categories: Fire (85.1%), Overpressure Rupture (11.9%), and Rescue & EMS (3.0%).
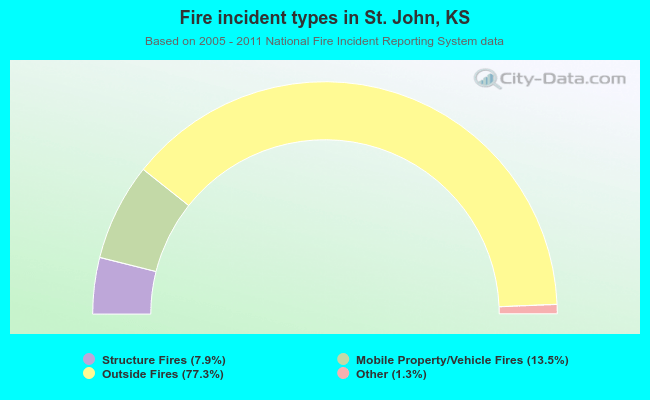 When looking into fire subcategories, the most incidents belonged to: Outside Fires (77.3%), and Mobile Property/Vehicle Fires (13.5%).