St. Paul: Fire Incidents, Minnesota (MN)
Where are fire incidents reported in St. Paul, MN
Something went wrong! Please refresh the page.
| Fire incidents reported | |
|---|---|
| Sreet name | Count |
| GLUMACK DR | 274 |
| GATE | 246 |
| N TERMINAL LANE | 4 |
| BLOOMINGTON RD | 2 |
| CO. RD. 68 | 2 |
| COMO AVE | 2 |
| CONWAY ST | 2 |
| EUCLID ST | 2 |
| GLUMACK DR | 2 |
| HWY 5 | 2 |
| KASOTA AVE | 2 |
| LAVELL RD. | 2 |
| OTHER CITY | 2 |
| PARKWAY DR | 2 |
2002 - 2011 National Fire Incident Reporting System (NFIRS) incidents
- Incident types reported to NFIRS in St. Paul, MN
- 3,02563.2%Rescue & EMS
- 1,14523.9%Hazardous Condition
- 2735.7%Fire
- 1773.7%False Alarm
- 1443.0%Good Intent Call
- 190.4%Service Call
- Fire incident types reported to NFIRS in St. Paul, MN
- 9835.9%Outside Fires
- 9434.4%Mobile Property/Vehicle Fires
- 6523.8%Structure Fires
- 165.9%Other
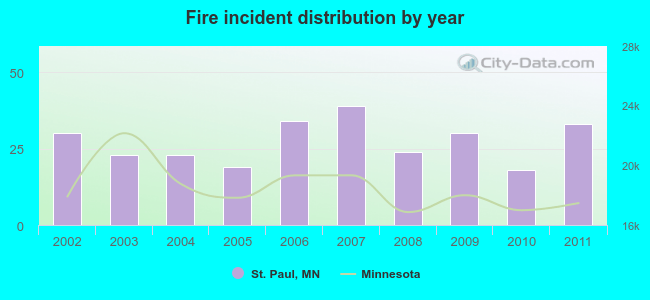 According to the data from the years 2002 - 2011 the average number of fire incidents per year is 27. The highest number of fire incidents - 39 took place in 2007, and the least - 18 in 2010. The data has a growing trend.
 35.2% incidents where reported in the morning and 64.8% in the evening. The most fires (20.5%) took place on Wednesday, and the least (10.6%) on Sunday.
 Based on the 273 fire incidents from years 2002 - 2011 most fires (11.0%) took place during May, and the least (5.9%) in November.
 Out of all 4,786 cases reported during the years 2002 - 2011, the most belonged to the categories: Rescue & EMS (63.2%), Hazardous Condition (23.9%), and Fire (5.7%).
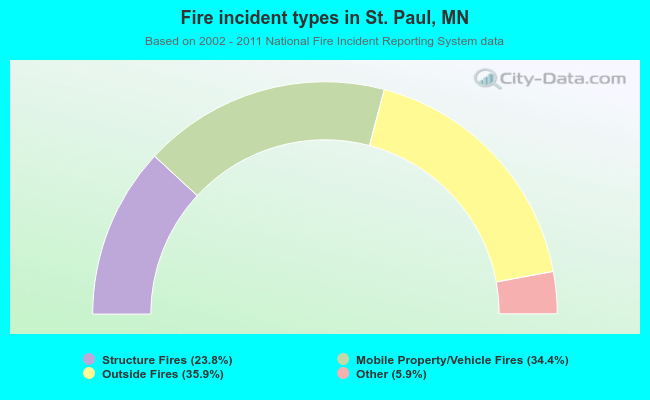 When looking into fire subcategories, the most incidents belonged to: Outside Fires (35.9%), and Mobile Property/Vehicle Fires (34.4%).